
From Data to Value
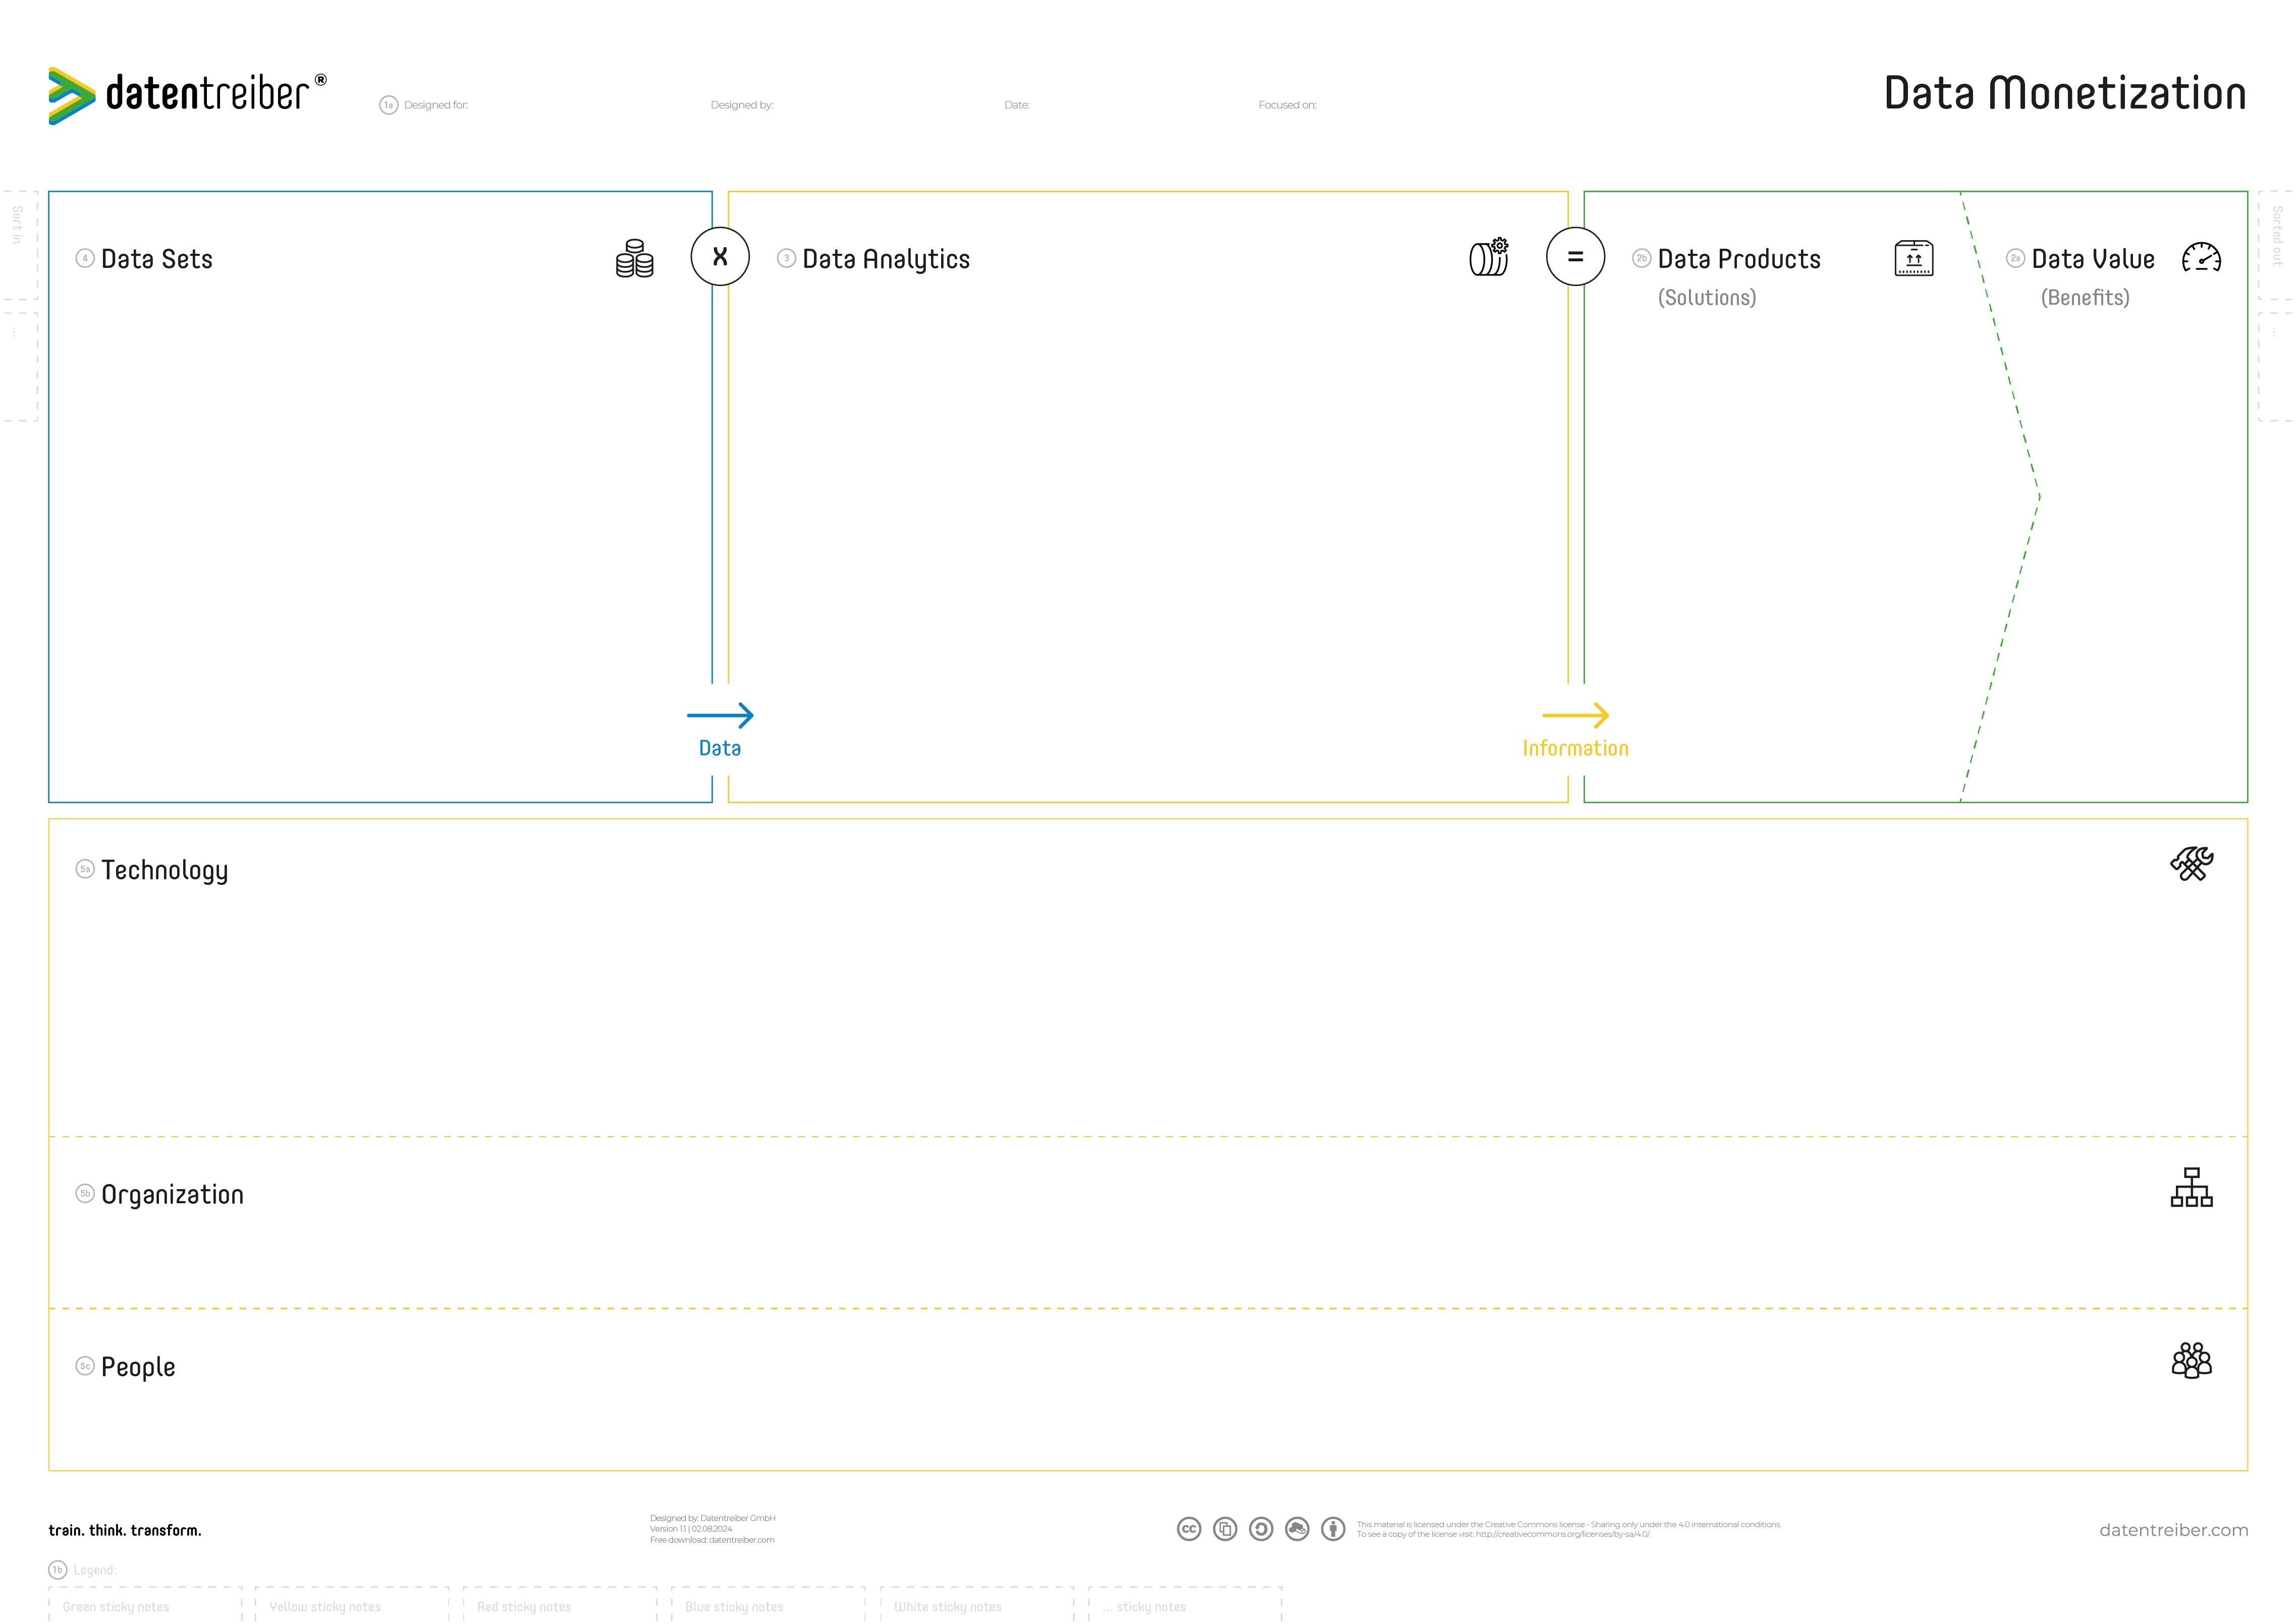
The Data Monetization Canvas
Transform raw data into valuable assets with the Data Monetization Canvas. This tool streamlines the process of designing and implementing impactful analytics and AI solutions.
What is the Data Monetization Canvas?
The Data Monetization Canvas is designed to help organizations plan and develop data and AI products that generate measurable business value. It provides a structured way to map out the entire process of transforming raw data into valuable insights and products. By detailing each step—from identifying required data sets and designing analytics processes to defining the data products and assessing their value—the canvas ensures that every aspect of data monetization is carefully considered.
This canvas guides you through:
- Data Value Identification: Clarifying the monetary value that the data products are expected to generate, often linked to business performance metrics or key performance indicators (KPIs).
- Data Product Definition: Outlining the specific outputs of data analytics, such as reports, dashboards, predictive models, or APIs, that deliver valuable information to users.
- Data Analytics Planning: Detailing the necessary analysis steps to extract information from data, including data collection, cleaning, transformation, modeling, and visualization.
- Data Set Identification: Determining the data sets required to perform the analytics, considering existing and needed data sources.
- Technical Requirements: Specify the technological infrastructure needed to implement and operate the data sets, analytics processes, and data products, including tools, platforms, and systems.
- Organizational Structure: Identifying the organizational units responsible for various components of the data monetization process, ensuring clear ownership and accountability.
- Personnel Needs: Defining the roles, skills, and capacities of the people required to develop and maintain the data products and supporting infrastructure.
By systematically working through the entire lifecycle of data monetization, the Data Monetization canvas helps ensure that data and AI products are technically feasible, aligned with business objectives, and capable of delivering measurable value.
When to Use the Data Monetization Canvas
The Data Monetization Canvas is applicable in several scenarios:
- Designing Data and AI Products: When you have an idea or concept for a data or AI product and need to design the analytical solution, including mapping out data flow, analysis steps, and desired outputs.
- Identifying Development Requirements: To derive the technical, organizational, and personnel requirements necessary to develop and implement the data or AI product effectively.
- Mapping Data Flow and Analytics Steps: When planning the data sets, analytics methods, and processes required to transform data into valuable information.
- Aligning Data Products with Business Objectives: To link the data product to business performance metrics and key results, ensuring it delivers measurable value aligned with organizational goals.
How Do I Use the Data Monetization Canvas?
Data monetization means generating monetary value from data. This can occur internally, by improving business processes and decision-making, and externally, by creating new revenue streams from data products or services.
Data itself has no value until refined into information through data analytics. The result of applying analytics to data sets is a data product, which is often part of a larger solution, such as an IT application.
The value of data depends on the use case: How does the information improve decisions and actions, and thus the achievement of objectives and results for its users? Consequently, the data value equals the sum of the information values for all use(r) cases.
Refer to the Analytics & AI Use Case canvas to define data analytics and AI use cases.
Internally, data is used to decrease costs and risks or to increase revenue or other financial benefits. Data products are often wrapped in a reporting or dashboarding application, with the users being employees of the organization or its suppliers and service providers.
Externally, data can be used as part of existing products or services or sold as a stand-alone product (data licensing), as a service (DaaS: data-as-a-service), or in combination with an analytical or AI software application (SaaS: software-as-a-service). Even when data is sold directly, it is first processed using data analytics—e.g., cleansed, normalized, aggregated, and anonymized—to make it more usable, valuable, and compliant with data privacy and security regulations. The users in this case are the company’s customers.
AI products are a special form of data products and thus a form of data monetization. They are created from data and machine learning. Whenever data products are mentioned, AI products are included as well.
Data monetization requires technological infrastructure to store data sets, perform data analytics, and provide data products. The technological system must fit the requirements for the data sets, analytics, and products. The technology should neither be undersized nor oversized.
According to Conway’s Law, “Any organization that designs a system will produce a design whose structure is a copy of the organization’s communication structure.” Thus, the organizational (team) structure must fit the technological structure.
Finally, an organization depends on its people. Therefore, the personnel structure and culture must match the organizational structure.
To summarize: Data monetization requires the right technological, organizational, and people structure—a TOP structure.
The Canvas Sections
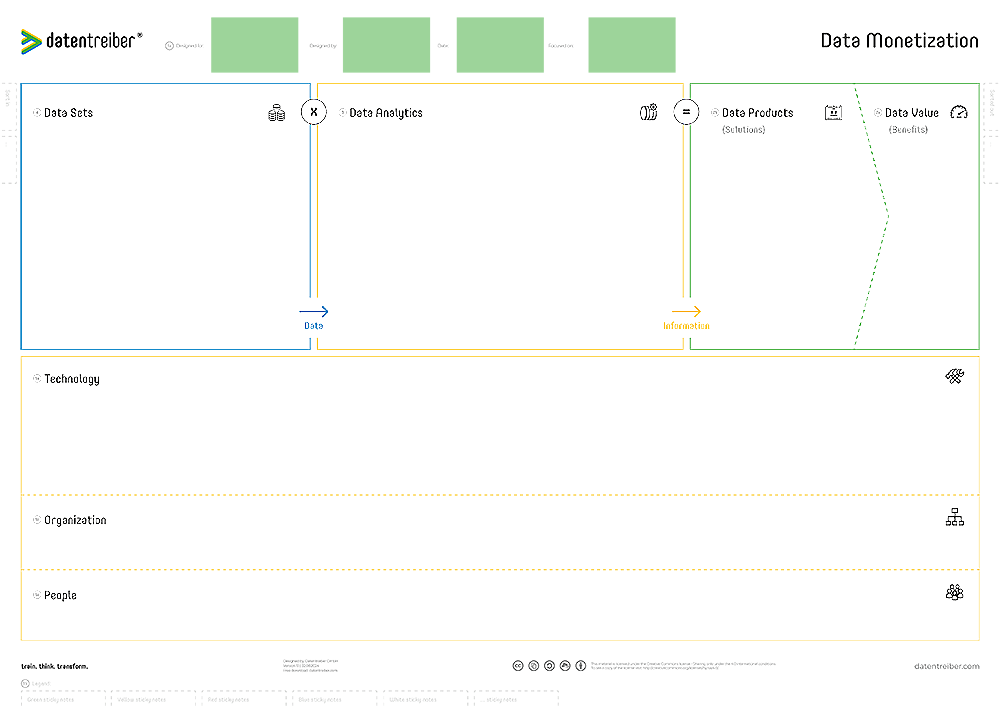
①a Header
The header defines the content of the canvas and should consist of the following information:
- Designed for: Which organization (company, department, team, etc.) does the content of the canvas concern?
- Designed by: Which organization (company, department, team, etc.) created the content?
- Date: When was the content created or last updated?
- Focused on: On which area/topic/case/etc. does the content of this canvas focus?
There should be no copies of the same canvas with identical headers, i.e., the header clearly identifies a version of the canvas (copy) and documents the current status of its content.
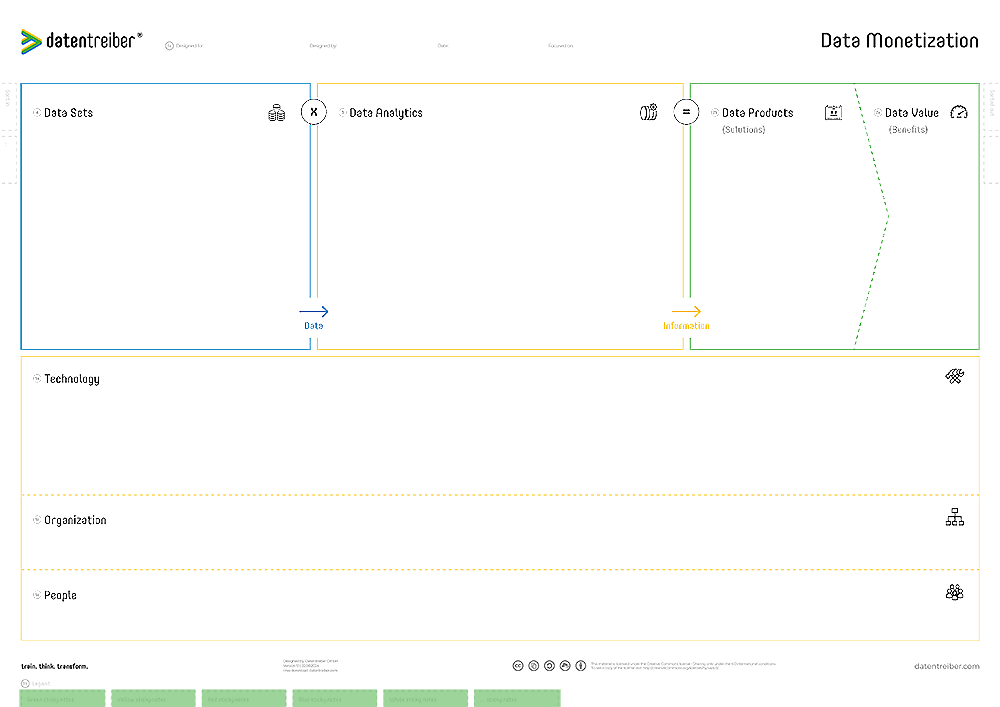
①b Footer
The footer explains the coloring of the sticky notes (and other formatting) on the canvas.
For each sticky note color, there should be an identically colored or formatted sticky note on the legend with a title explaining this specific sticky note category.
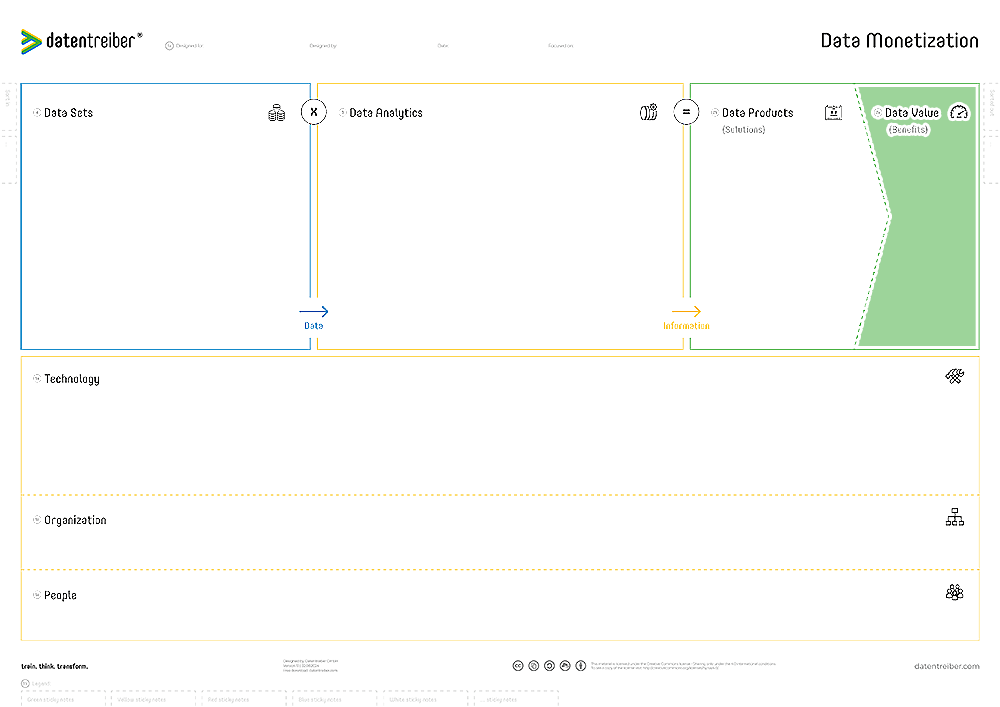
②a Data Value
What is and how to measure the monetary value of the data (products)?
When data is utilized through data products, it creates a benefit for their users and thus a value for the company, ideally measurable in monetary terms or at least indirectly linked to a monetary advantage.
If a data product has multiple use cases, the data value is the sum of the information values for each use case. Measuring and monitoring data value should be part of the data product to show users that the application brings added value, i.e., fulfills the proof of value. Existing key performance indicators (KPIs) are often used to measure the business performance of data products.
Since the value of data depends on the value of the information it provides, and information value depends on information quality, which in turn depends on data quality, information and data quality indicators are also important. One way of determining information quality is through model performance in predictive models.
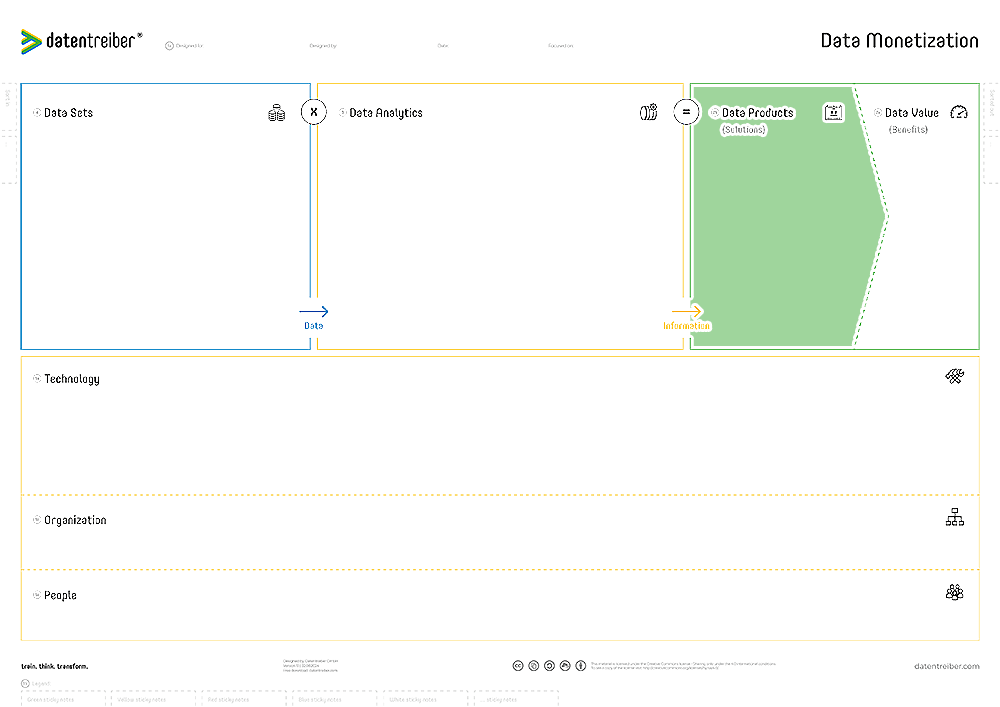
②b Data Products
What are the products of data analytics applied to the data sets?
A data product is the result of data and analytics, serving one or more analytical or AI use(r) cases. It delivers information to users with specific needs (i.e., questions in the context of decision-making and objectives).
- One-time reports as static presentations or documents (e.g., PDF)
- Interactive dashboards with an easy-to-use graphical user interface (GUI)
- Intelligent chat bots with a language user interface (LUI)
- Simple console applications with a command line interface (CLI)
- Stand-alone (web) services via application programming interfaces (API)
- Integrated into operational applications, e.g., a recommendation engine as part of an e-commerce system
A data product should be reusable, scalable, and easy to use. The level of detail depends on the focus:
- If the focus is on one data product, the level is individual information.
- If the focus is on one application domain with multiple data products, the level is use case.
- If the focus is on one organization, the level is application domain.
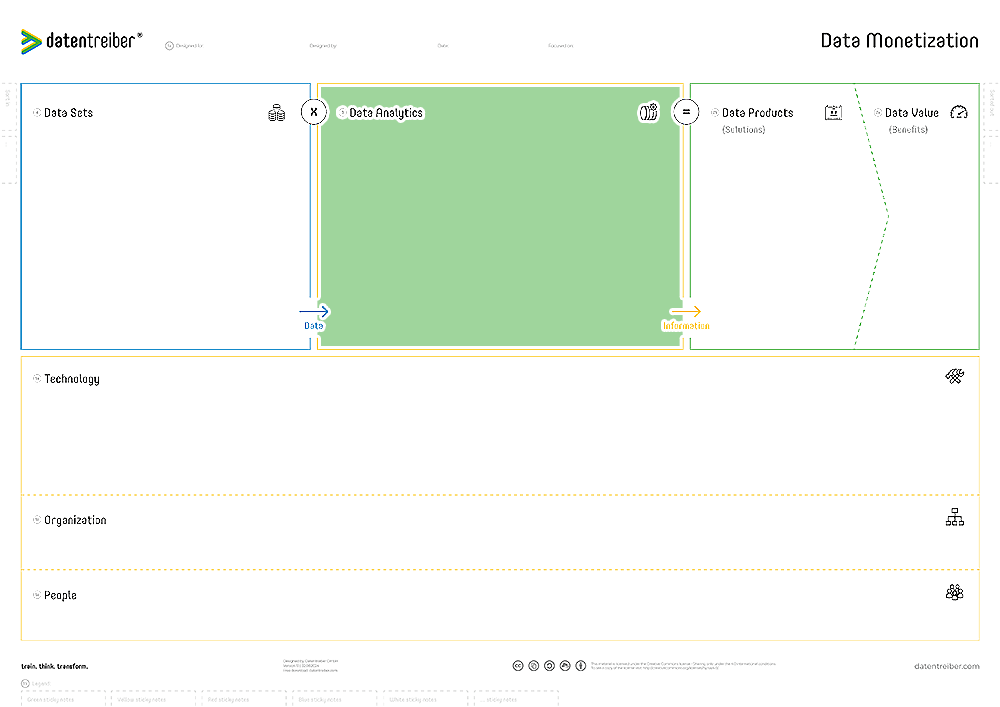
③ Data Analytics
What are the necessary analysis steps to extract the information from the data? Data analytics refers to the computational analysis of data using statistical and probabilistic tools and techniques.
The purpose of data analytics is to separate the “noise from the signal,” i.e., the information from the data.
The data analytics process often comprises the following phases:
- Data Collection: Gathering data from different sources (e.g., databases, sensors) and integrating the data.
- Data Cleaning: Ensuring data quality by removing errors, duplicates, outliers, etc.
- Data Transformation: Converting data into a suitable format or structure for analysis.
- Data Modeling: Applying statistical, mathematical, or machine learning methods to build a (descriptive, diagnostic, predictive, etc.) model.
- Data Visualization: Presenting data and analytical results in graphical or pictorial formats, such as charts, graphs, and dashboards.
Data analytics can be categorized into several types depending on the question and complexity or maturity of the analytics:
- Descriptive Analytics: What happened?
- Diagnostic Analytics: Why did it happen?
- Predictive Analytics: What could happen?
- Prescriptive Analytics: What should happen?
- Autonomous Analytics: Make it happen!
See the Analytics & AI Maturity canvas for more information on analytics and AI maturity.
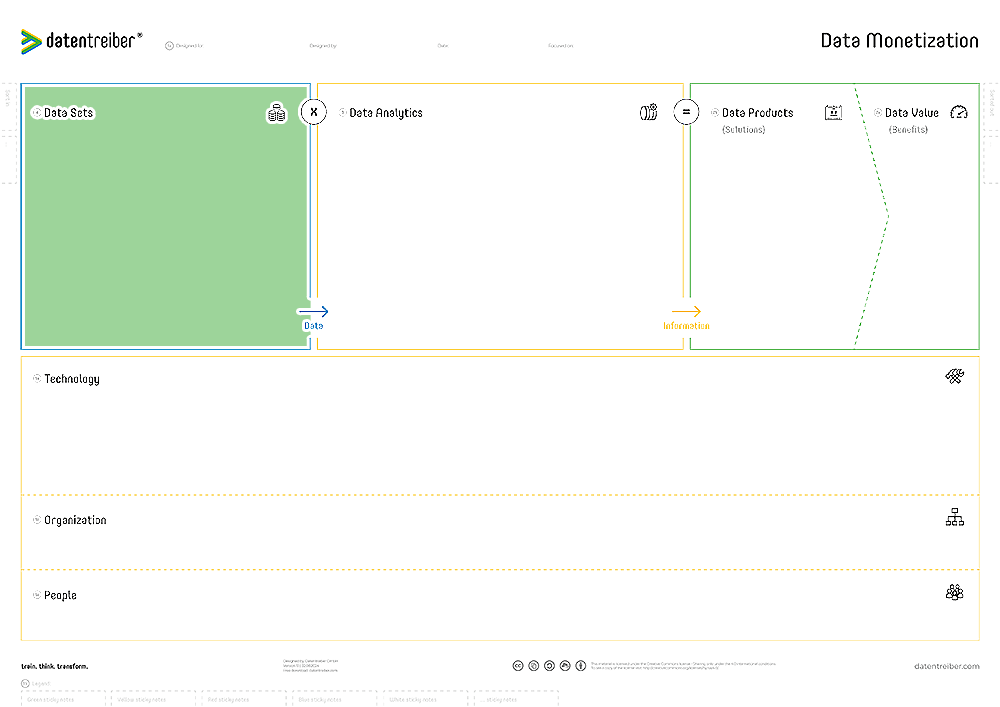
④ Data Sets
What are the required or useful data sets containing the desired information?
A data set is a collection of related data points, often presented in a structured format such as a table in a relational database or a spreadsheet. There is also semi-structured data, e.g., XML, HTML, or JSON files, and unstructured data, e.g., text documents, multimedia files, or social media posts.
Each data set has at least one data source, and one data source can provide multiple data sets. Typical data sources are database management systems (DBMS) such as SQL, NoSQL, or graph databases. However, a data set could also originate from an export from an enterprise application or be provided via application programming interfaces (API) or web services.
Web pages from websites or files from local or network drives are also potential sources of data.
See the Data Landscape canvas for more information on data sources.
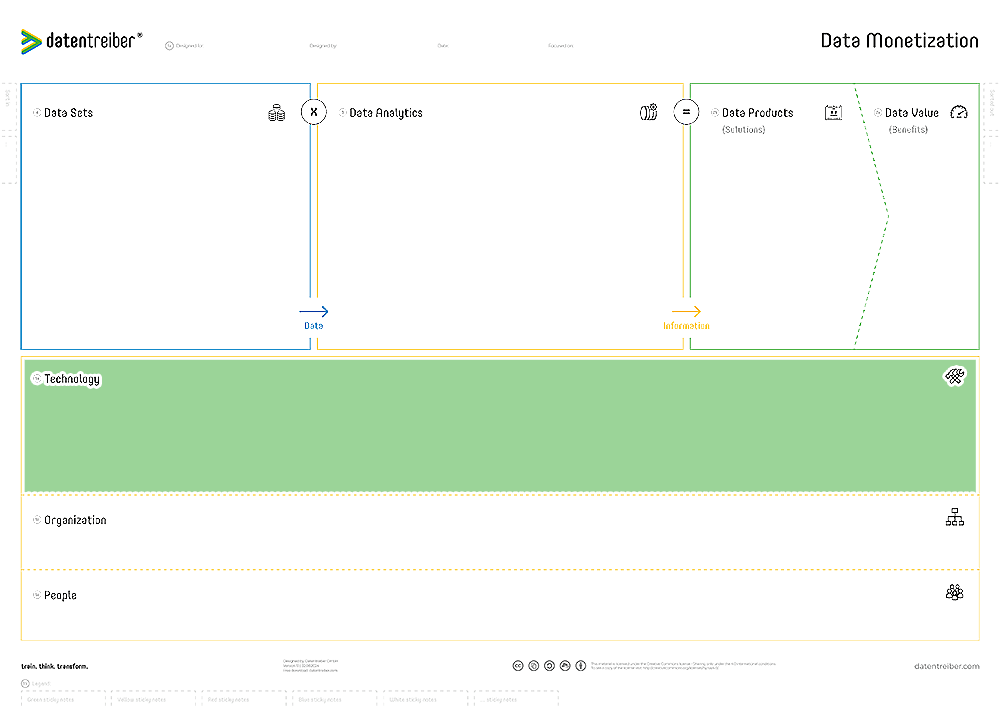
⑤a Technology
What technical infrastructure is required to implement and operate the data sets, analytics, and products?
Technology encompasses tools, techniques, components, systems, platforms, machines, networks, and other hardware and software. The collective product of these parts is called technical infrastructure, which forms the foundation for the implementation and operation of analytics and AI solutions.
The specific design of the technical infrastructure is called (IT) architecture, which is often layered:
- Physical Layer (bottom): Servers, storage devices, network devices, and other hardware.
- Platform Layer (middle): Operating systems or cloud systems.
- Data Layer (top left): Databases, data warehouses, data lakes, ETL tools, etc.
- Analytics/AI Layer (top middle): Machine learning libraries, data science IDEs, middleware, MLOps tools, etc.
- Presentation Layer (top right): Data visualization tools, dashboarding and reporting tools, GUI frameworks, etc.
The technical infrastructure defines the technical and analytical capabilities and requires technological initiatives to change or build these capabilities. The infrastructure relies on and mirrors the organizational structure.
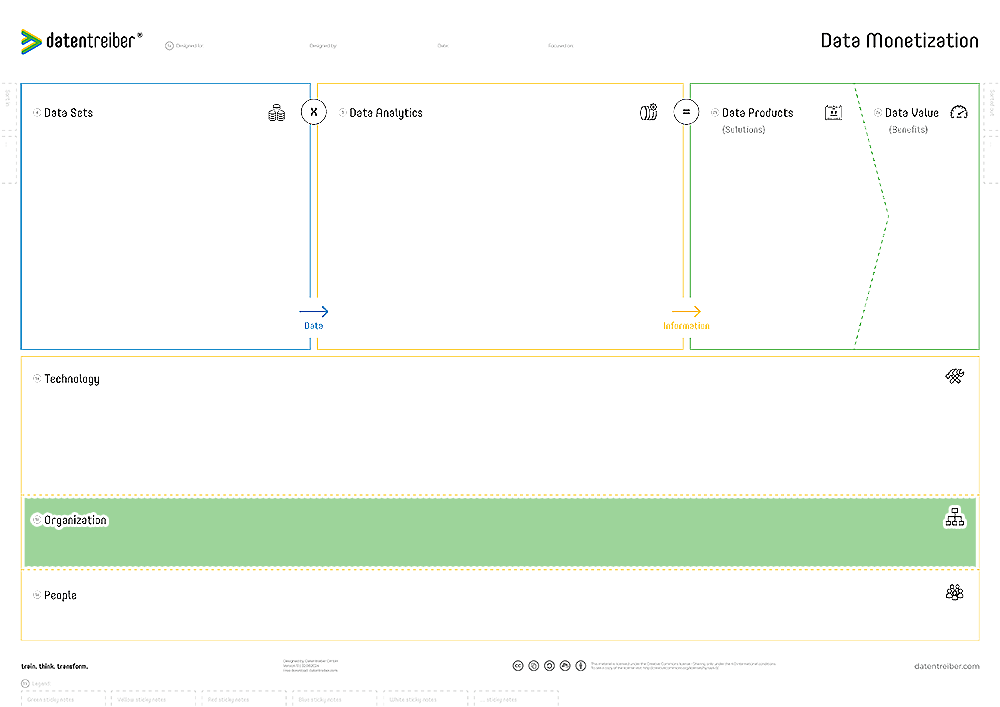
⑤b Organization
What organizational structure is required and what organizational units are responsible for the implementation and operation of the technical and analytical components as well as the data sets and products?
An organization is a structured group of people working together to achieve common objectives. An organizational unit can be a team, department, division, or separate company. Organizations are characterized by a defined structure, roles, rules, responsibilities, and processes that guide how activities are carried out and how resources are allocated to fulfill the objectives.
It is best practice for each data, analytics, software, and hardware component to be the responsibility of a single organizational unit. The worst case is if no unit takes responsibility or if responsibility is fragmented across multiple units.
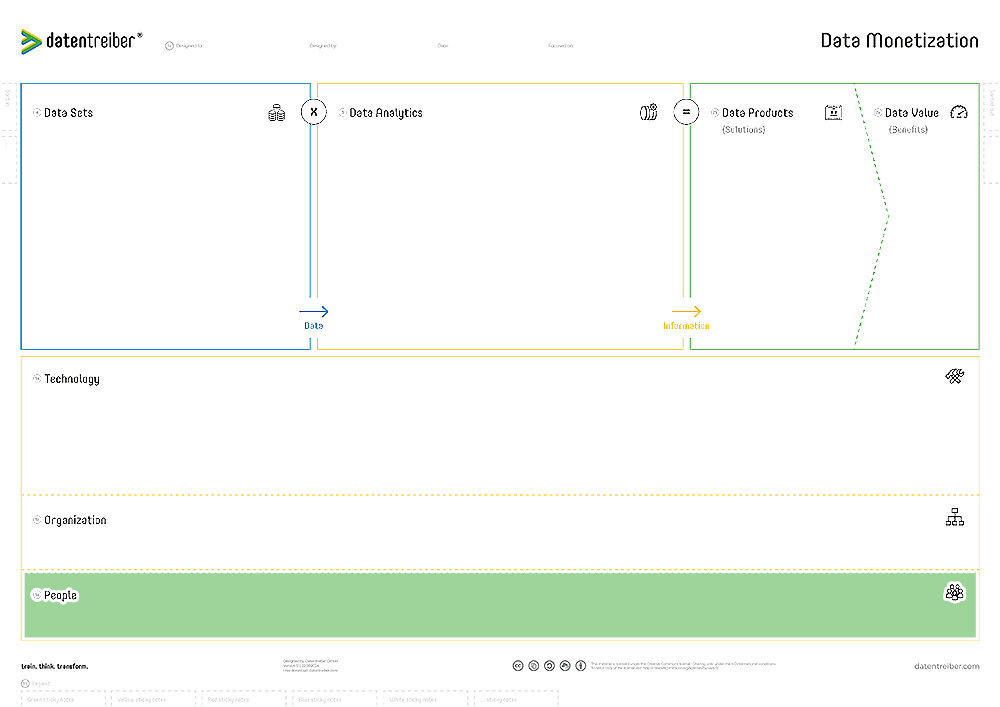
⑤c People
What personnel structure and culture are needed for the implementation and operation of the organizational structure, technical infrastructure, and the data sets, analytics, and products on top of those structures?
People are the foundation of successful businesses. Their skills, expertise, experience, and knowledge define the technical and analytical capabilities, while their behavior, values, attitudes, and ambitions shape the organization and its culture. Therefore, companies need the right people with the appropriate competencies and sufficient capacity.
These individuals must take on the proper roles and establish good relationships with others.
To adapt and expand their personnel structure and culture, organizations must take appropriate measures: recruitment, upskilling, change management, and more.

Where Can I Find More Information?
- Find detailed tutorials and examples on how to use the canvas in the context of designing a fully integrated data & AI strategy in our Data & AI Design Bench.
- Read this article on why you need a data & AI strategy (in german).
- Watch this presentation by Martin Szugat (in english).