From Data Gaps to Data Assets
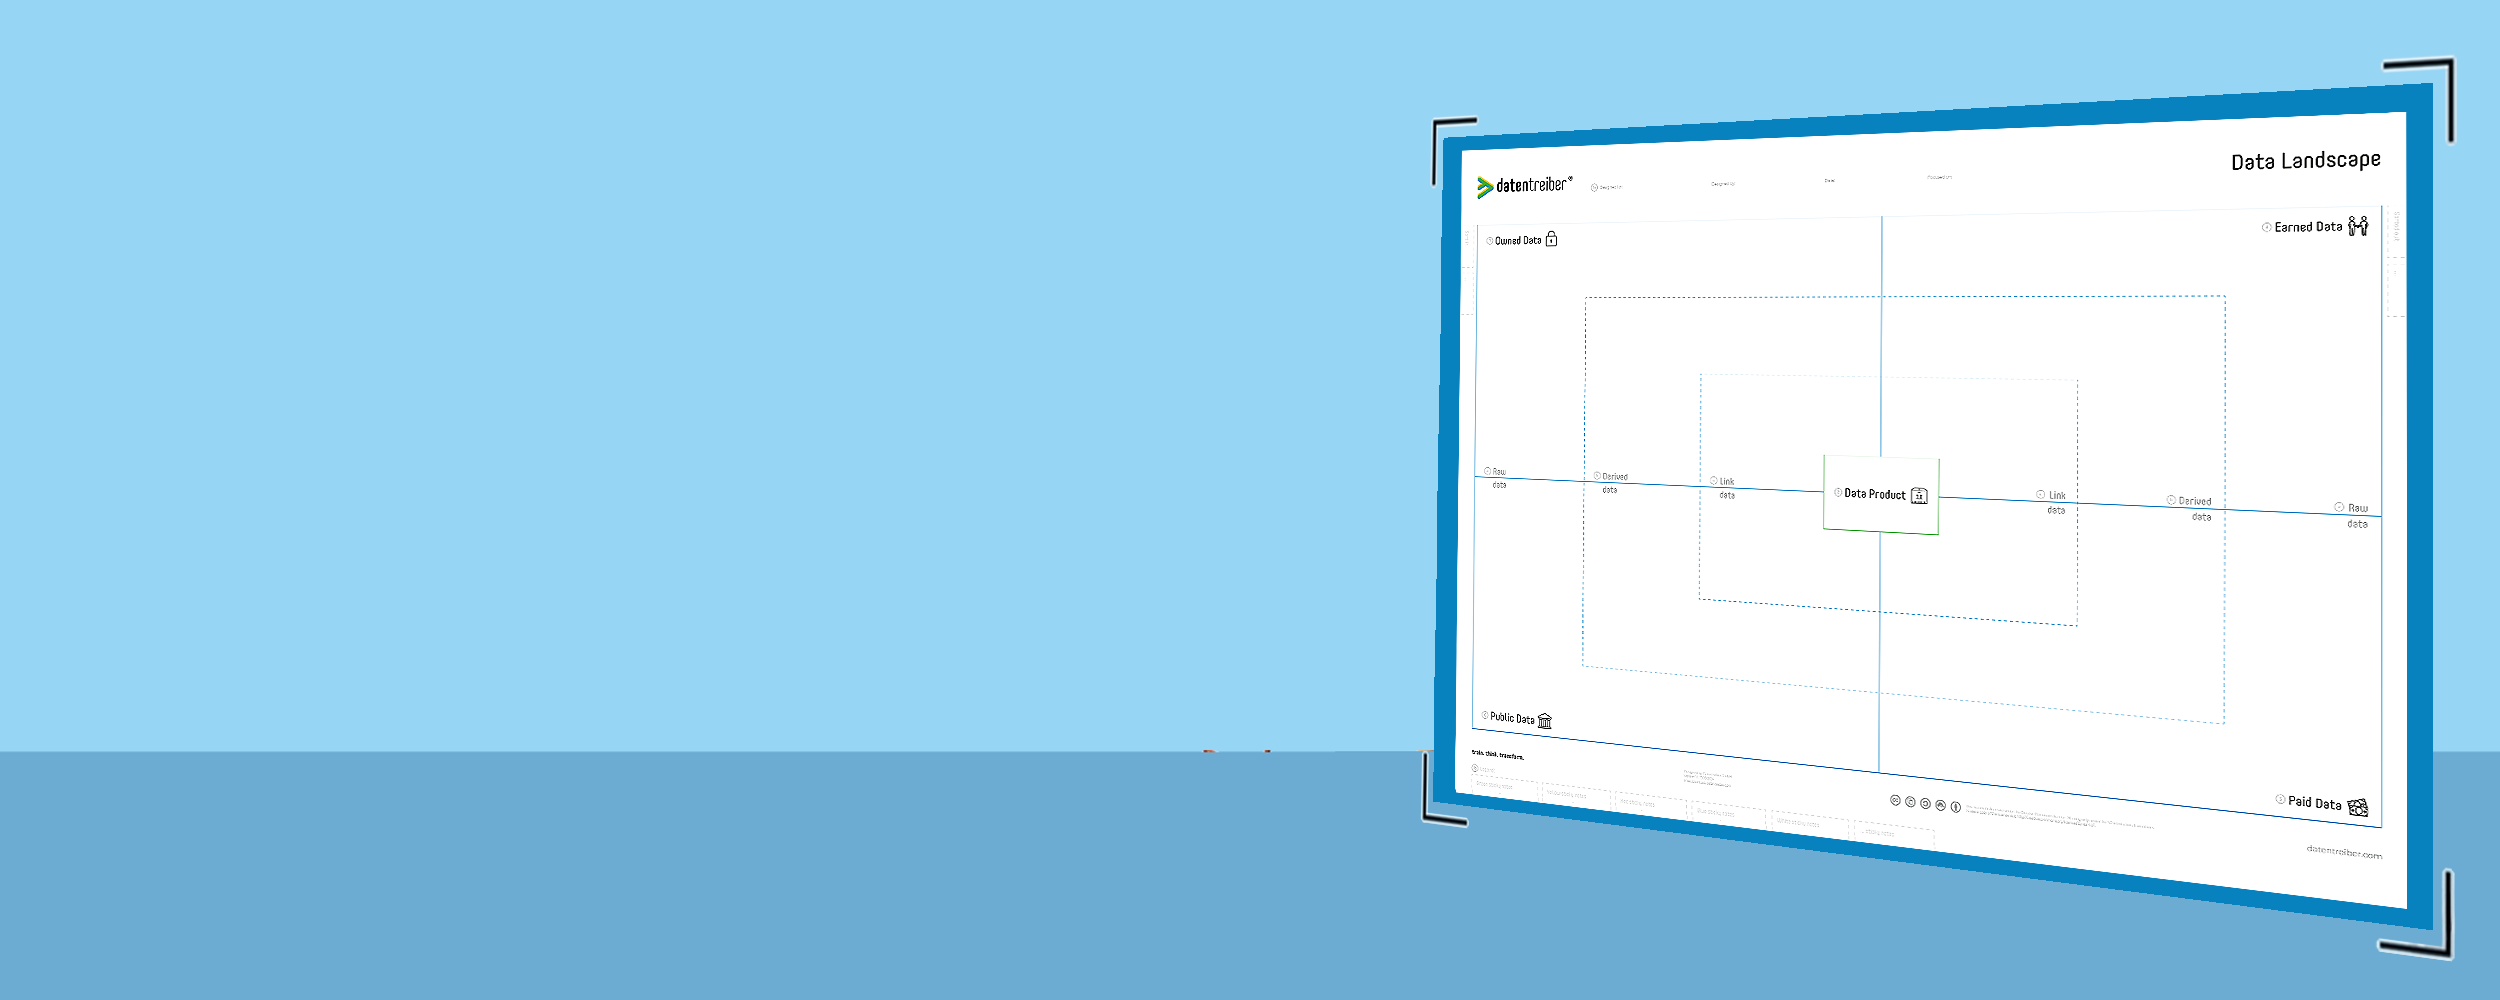
Data Landscape Canvas
By using the Data Landscape Canvas you explore new data sources and discover new data suppliers. It helps you to assess your company data and to identify the proper data sources for your utilization scenarios.
What is the Data Landscape Canvas?
The Data Landscape Canvas helps you understand and manage the wide range of data sources that could power your data & AI products. By mapping out where data originates—be it owned internally, earned from customers and partners, purchased from external providers, or publicly available—you gain a clear perspective on what’s accessible, what’s missing, and what may require additional effort to obtain or improve.
This structured view ensures that you’ve considered the necessary data inputs and any associated quality, legal, or privacy factors before investing in analytics or AI solutions. Whether your focus is a specific data/AI product or the organization’s broader data ecosystem, the Data Landscape Canvas guides you in identifying critical data sets, highlighting gaps, and strategizing how to fill them. It encourages a forward-looking approach to data management, helping you discover new sources, refine data quality, and design processes that continuously feed into value-generating analytics and AI applications.
The Data Landscape Canvas is available for free under a Creative Commons license: You may use and modify the canvas as long as you cite Datentreiber in particular as the source.
When to Use the Data Landscape Canvas?
The Data Landscape Canvas is especially useful in scenarios such as:
- Preparing for Analytics or AI Projects:
Before developing a data-driven product or applying advanced analytics, use the canvas to pinpoint which data sets are required, verify their availability and quality, and ensure you can integrate them seamlessly. - Assessing Data Readiness for Use Cases:
If you’ve identified promising analytics or AI use cases, the canvas helps confirm whether the necessary data is accessible and appropriate. It reveals data gaps or issues, guiding you to adjust goals or find new data sources.. - Strategic Data Sourcing and Improvement:
For organizations looking to broaden their data horizon beyond internal systems, the canvas surfaces opportunities to acquire or exchange external data, capture more owned data, or refine current data sets. This ensures you have the right inputs to support long-term data and AI strategies.
By applying the Data Landscape Canvas, you build a strong foundation for effective data utilization and continuous growth in analytics and AI maturity, ensuring that information flows naturally into your products, services, and decision-making frameworks.
How Do I Use the Data Landscape Canvas?
Description is coming soon…
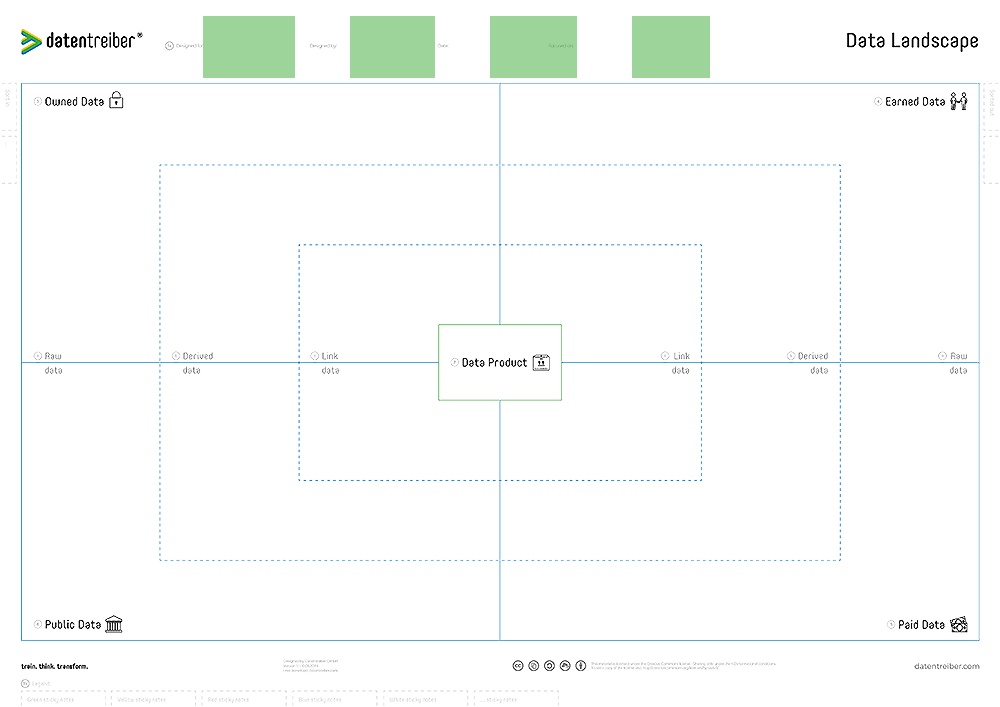
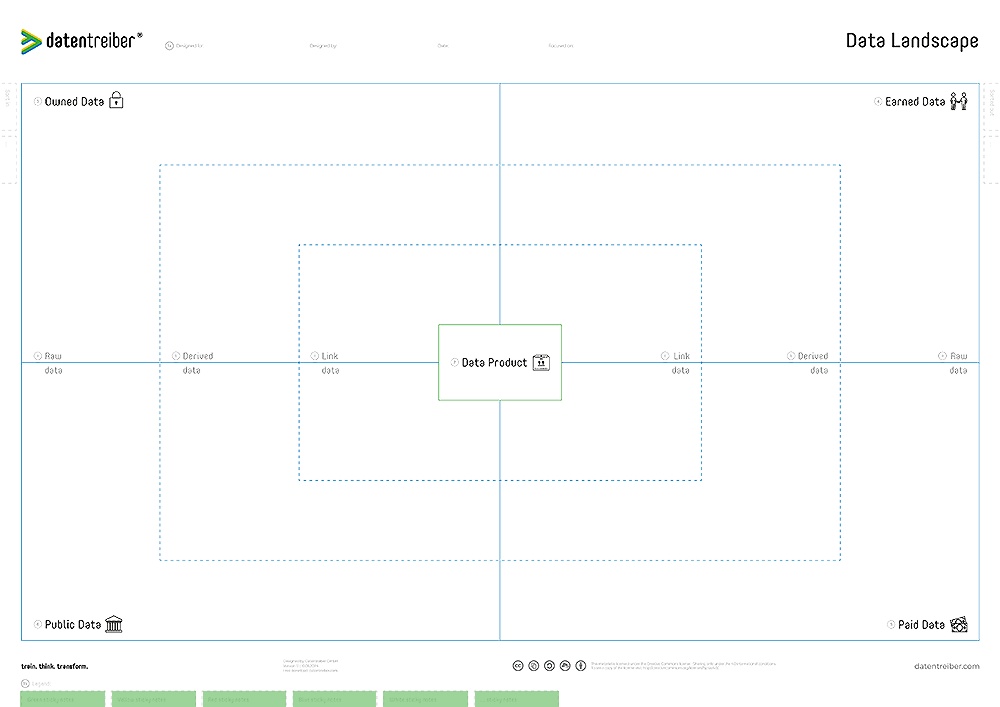
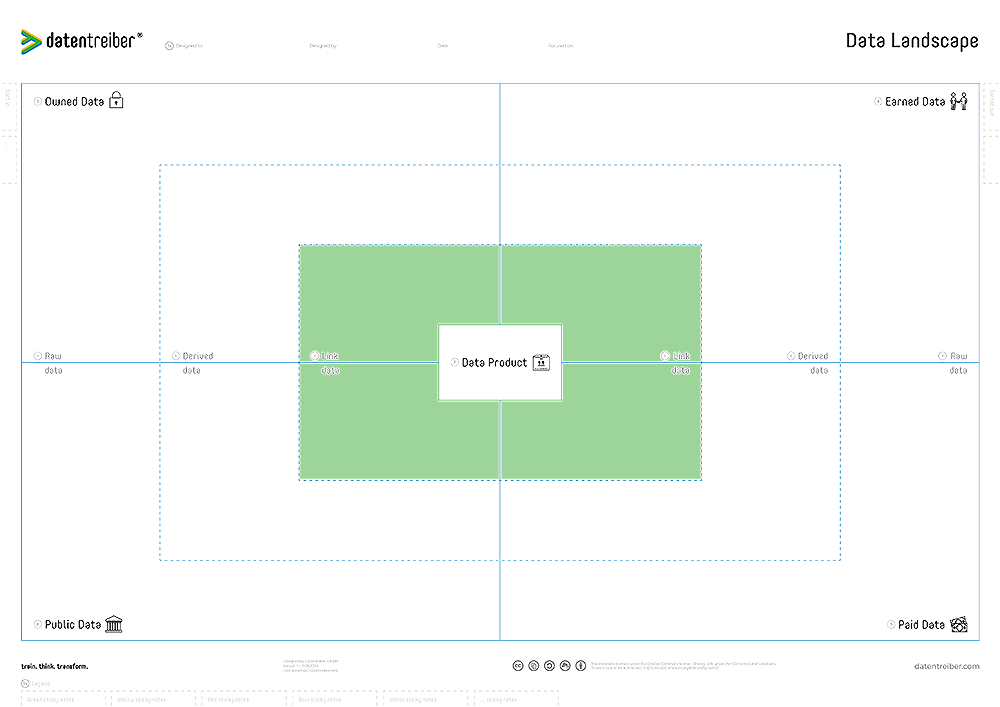
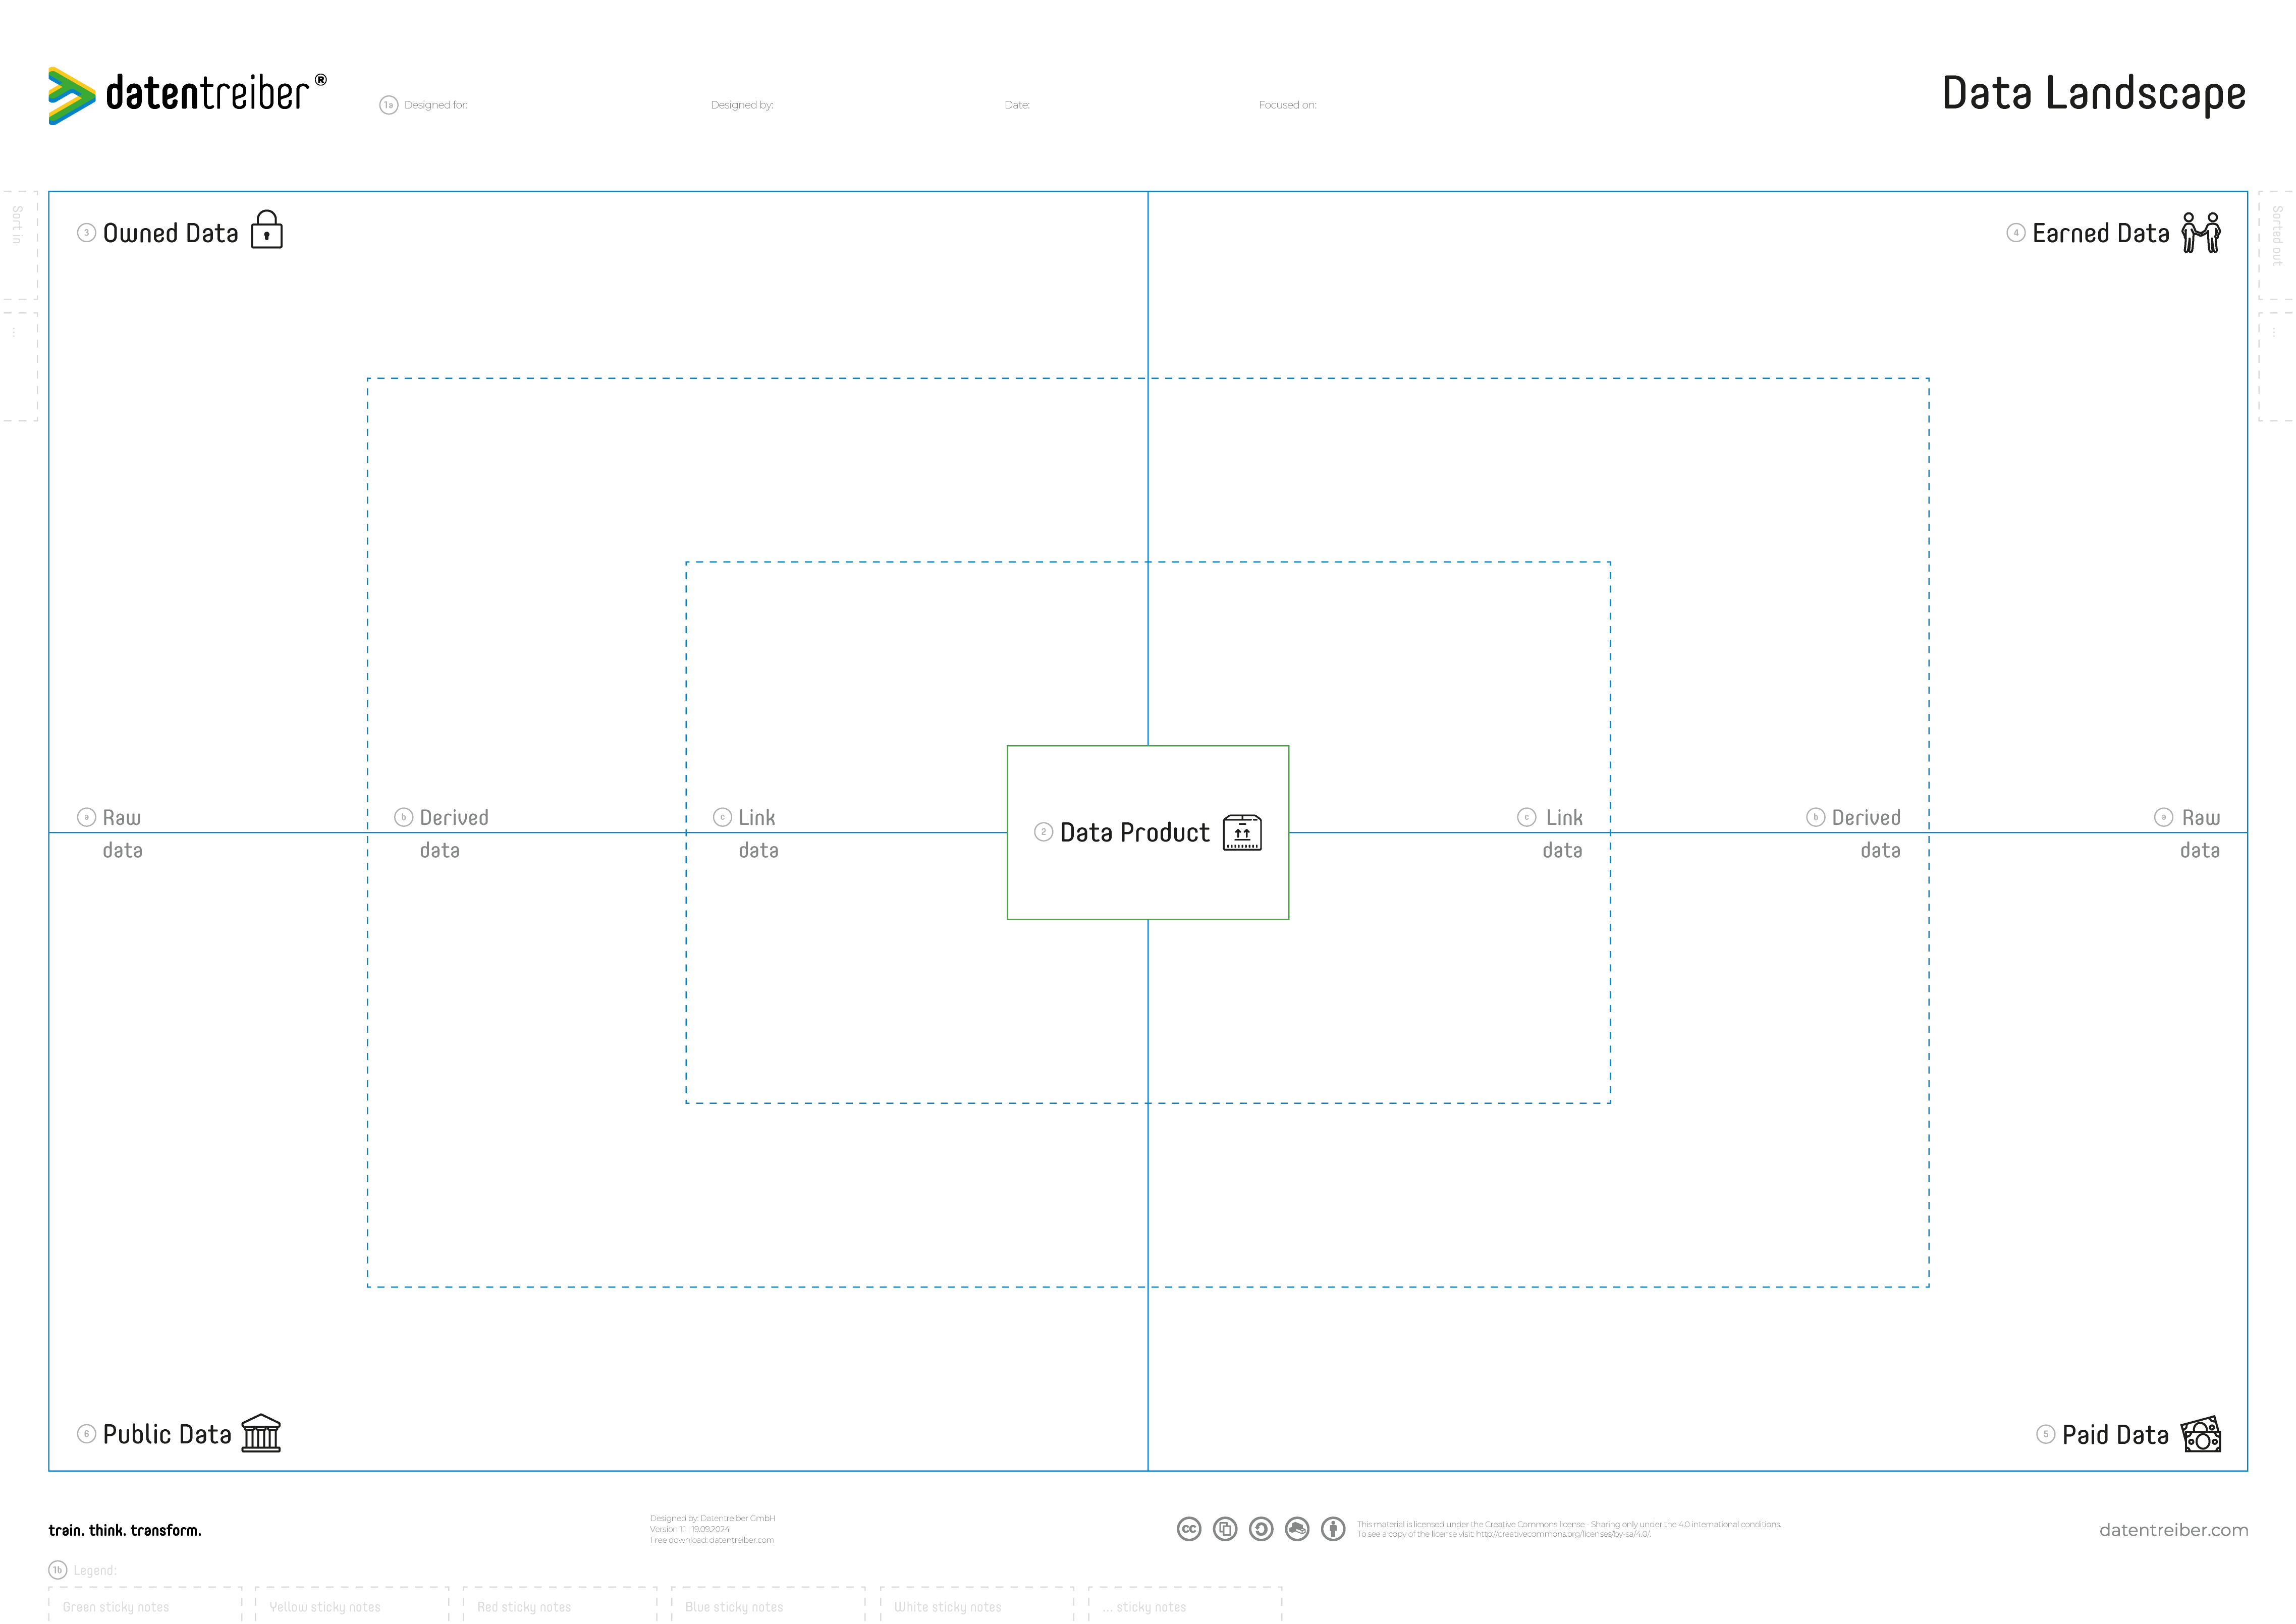
①a Header
The header defines the content of the canvas and should consist of the following information:
- Designed for: Which organization (company, department, team, etc.) does the content of the canvas concern?
- Designed by: Which organization (company, department, team, etc.) created the content?
- Date: When was the content created or last updated?
- Focused on: On which area/topic/case/etc. does the content of this canvas focus?
There should be no copies of the same canvas with identical headers, i.e., the header clearly identifies a version of the canvas (copy) and documents the current status of its content.
①b Footer
The footer explains the coloring of the sticky notes (and other formatting) on the canvas.
For each sticky note color, there should be an identically colored or formatted sticky note on the legend with a title explaining this specific sticky note category.
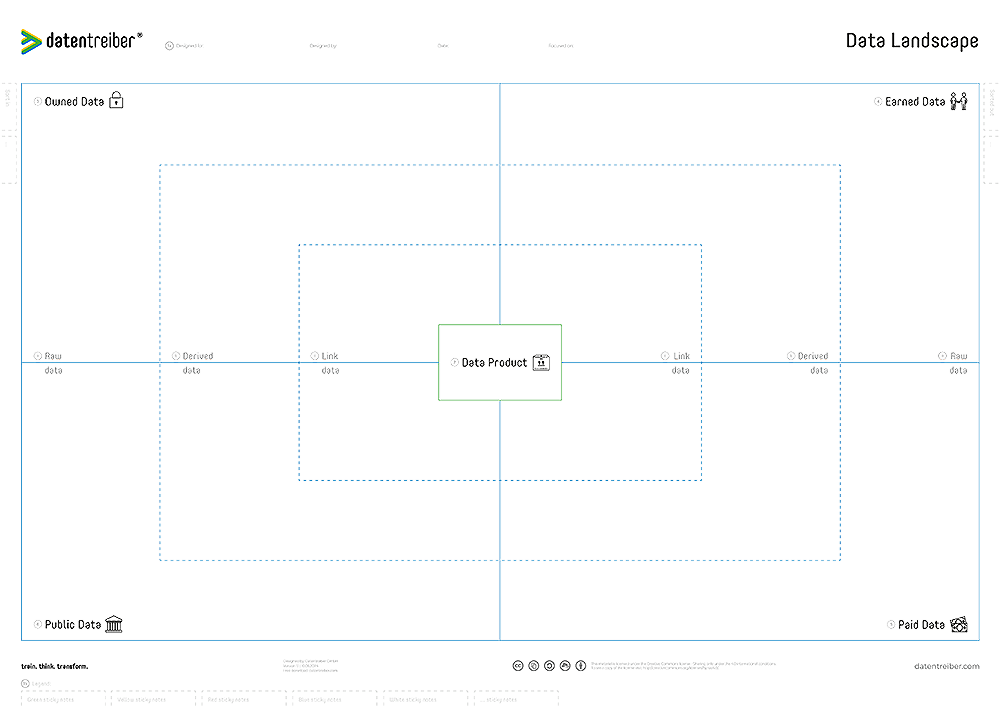
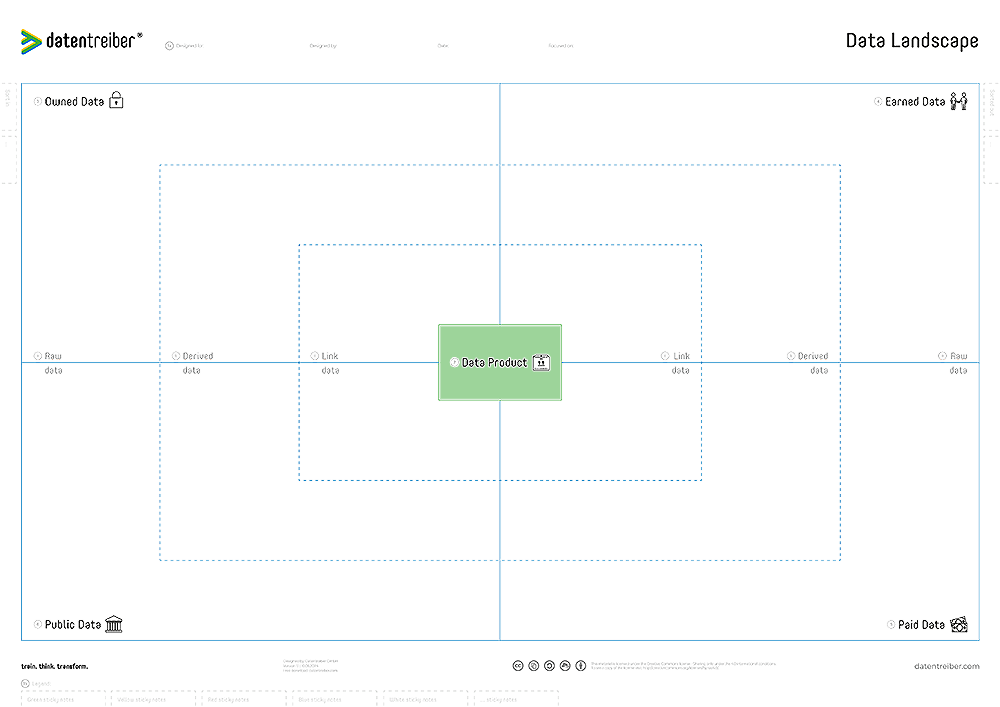
② Data Products
Placeholder text for the Data Products section.
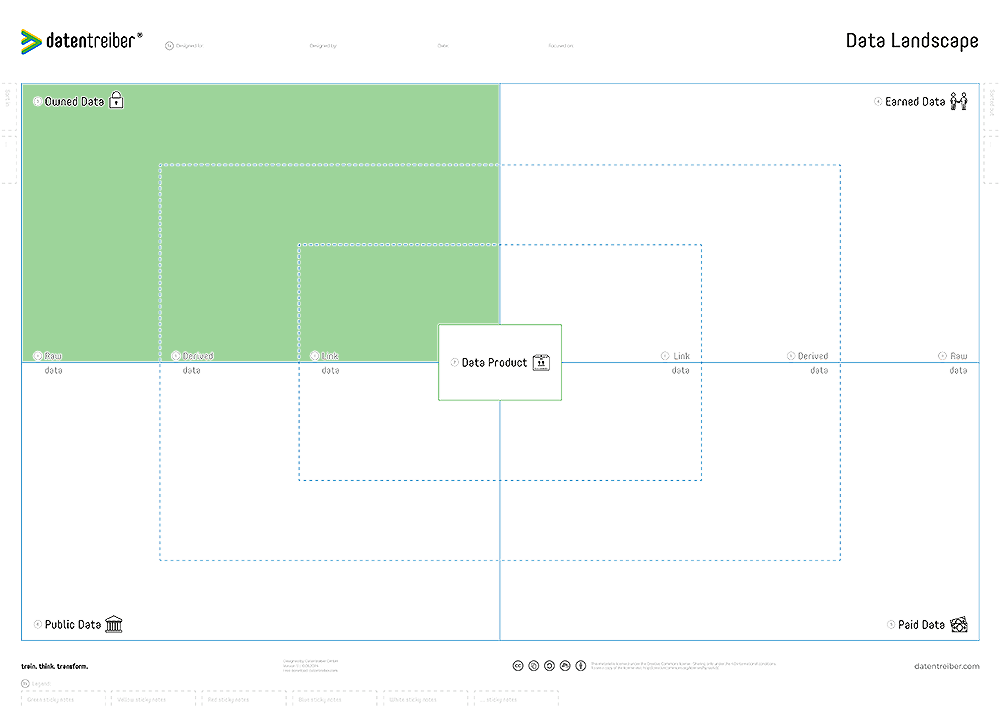
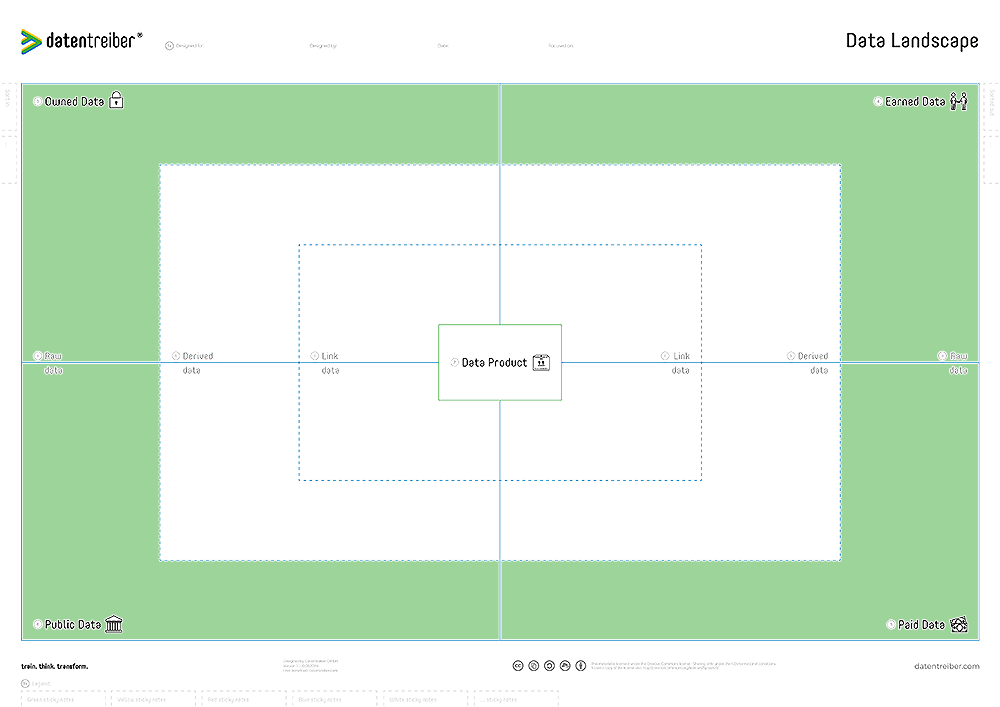
③ Owned Data
Data created by our employees, measured by our systems, or collected for us by external service providers and completely as well as exclusively owned by us.
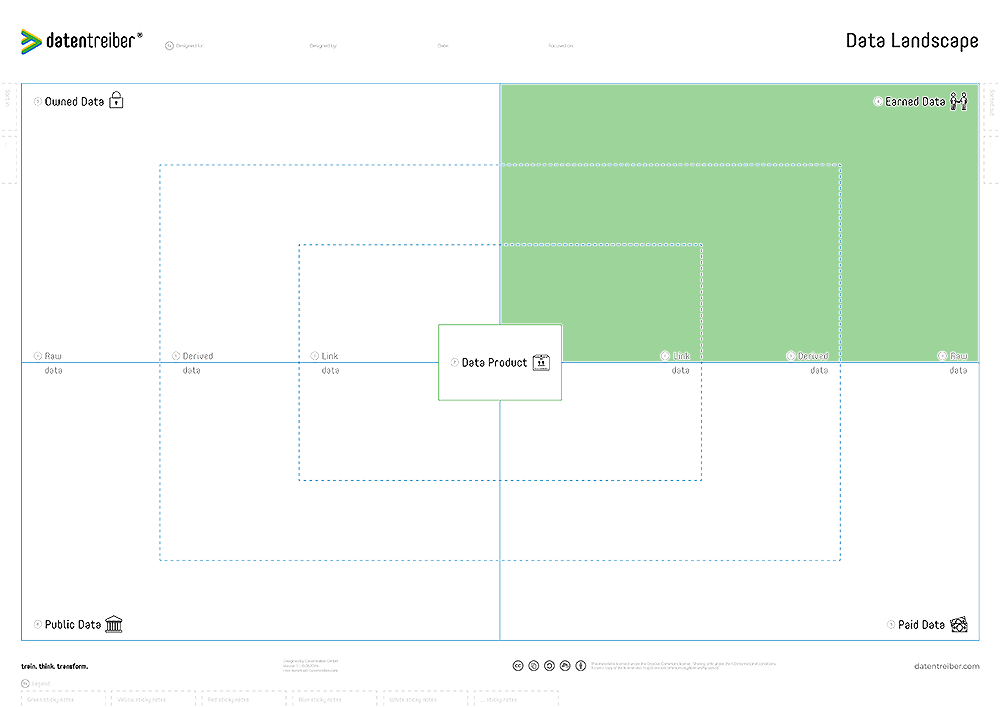
④ Earned Data
Data of our customers and partners (also known as first-party data), obtained through our marketing, sales, distribution, or service channels.
We have limited rights of use (e.g., due to data protection regulations) for this data and cannot be certain that we have it exclusively. Earned data can be collected using so-called data traps, where customers and/or partners provide their data in exchange for using a particular service or to receive a more personalized version of a service they already use.
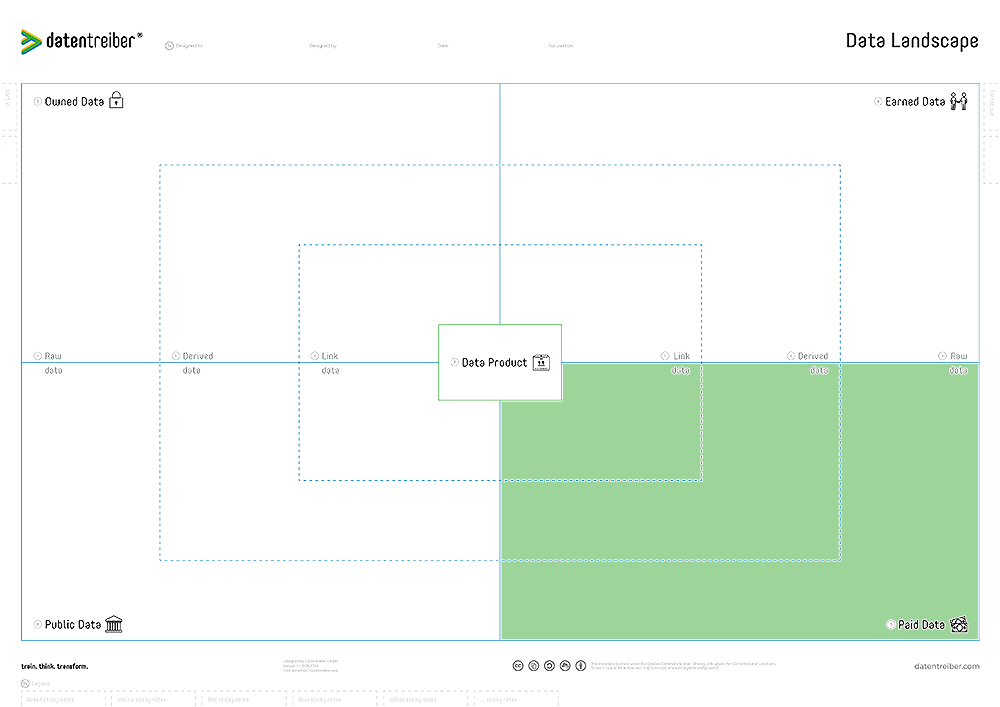
⑤ Paid Data
Data obtained from partners, data brokers, and/or data marketplaces, either by purchasing or receiving in exchange for our own data or other services.
We do not have comprehensive or exclusive rights of use for this data (second-party and/or third-party data).
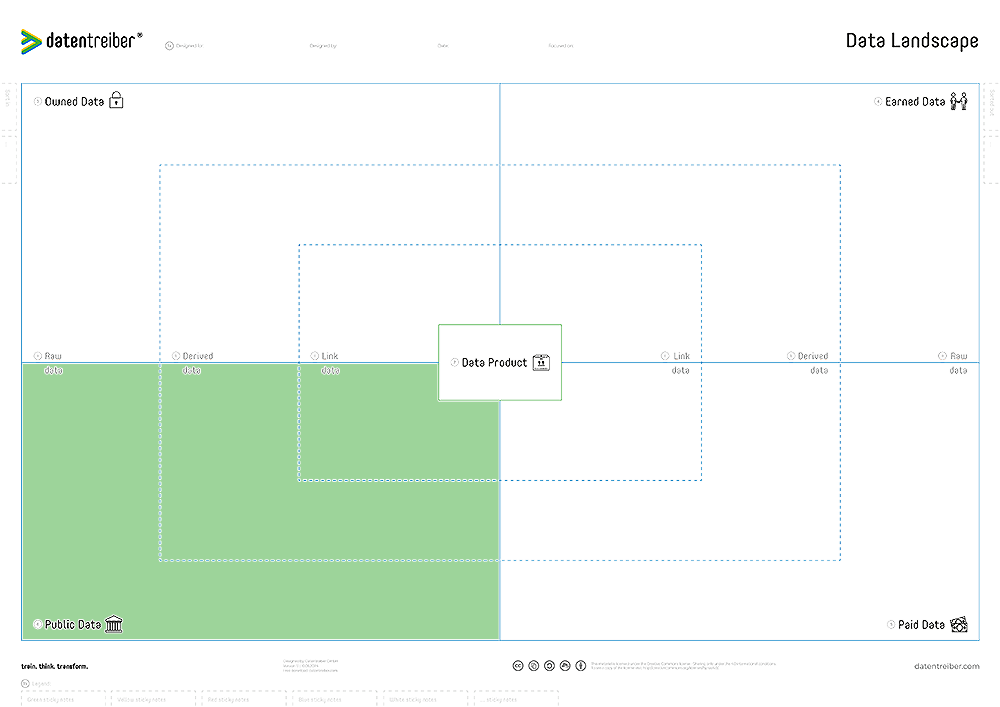
⑥ Public Data
Data freely and publicly available but possibly subject to legal restrictions (e.g., open data).
Additionally, we do not have this data exclusively.
a Raw Data
Placeholder text for the Raw Data section.
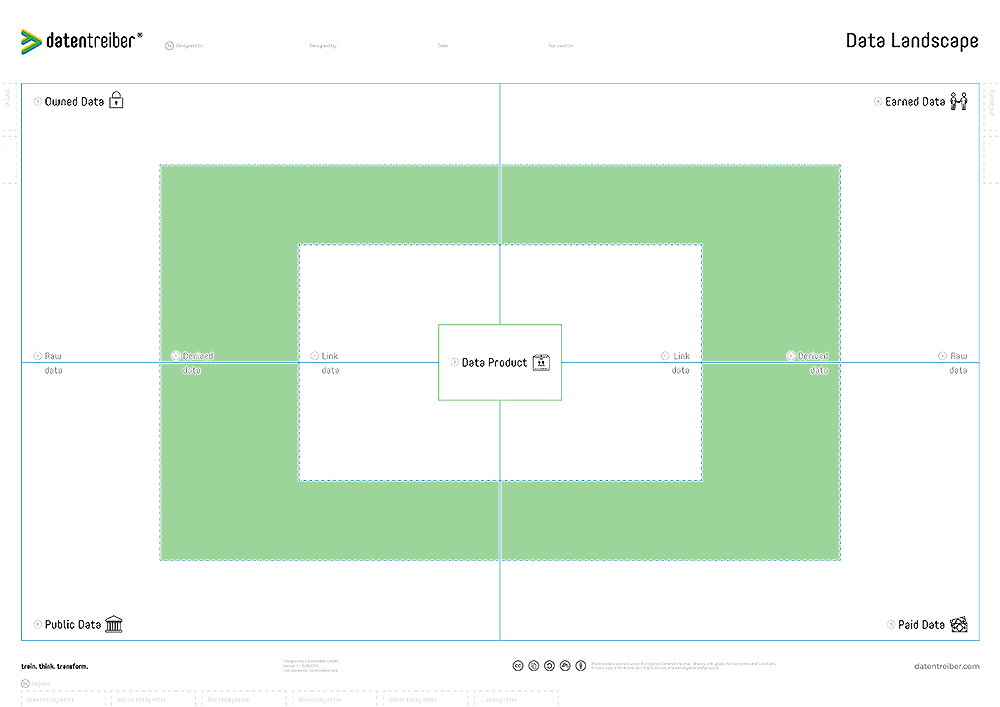
b Derived Data
Placeholder text for the Derived Data section.
c Linked Data
Placeholder text for the Linked Data section.
Where Can I Find More Information?
- Find detailed tutorials and examples on how to use the canvas in the context of designing a fully integrated data & AI strategy in our Data & AI Design Bench.
- Explore your Data Landscape (Blog)
- Data Thinker Group (LinkedIn)