
From IT to AI
The Analytics & AI Maturity Canvas
Plan, prioritize, and elevate analytics and AI capabilities across application domains with the Analytics & AI Maturity canvas. This tool helps structure development, identify dependencies, and design a roadmap for scalable implementation.
What is the Analytics & AI Maturity Canvas?
The Analytics & AI Maturity Canvas helps you categorize and prioritize analytics and AI applications according to their maturity level. It covers a range of analytical progressions, beginning with operational business applications and simple reporting tools, then moving into diagnostic approaches that explain why something happened, predictive methods that forecast what could happen, prescriptive techniques that recommend what should happen, and ultimately autonomous systems that decide and act on their own.
By mapping each application onto these maturity stages, you gain insight into your current capabilities, identify gaps that need to be filled, and determine prerequisites for advancing to more sophisticated analytics and AI solutions. This perspective reveals logical pathways for implementation, allowing you to create a step-by-step roadmap for enhancing data-driven decision-making and increasing the overall impact of analytics and AI within your chosen domain.
Whether refining existing tools or exploring entirely new applications, the canvas supports incremental development. It ensures that every step builds on the previous one, so you can progress methodically toward more advanced stages of analytics maturity, ultimately improving business processes and creating tangible value through well-orchestrated analytics and AI systems.
The Analytics & AI Maturity Canvas is available for free under a Creative Commons license: You may use and modify the canvas as long as you cite Datentreiber in particular as the source.
When to Use the Analytics & AI Maturity Canvas?
The Analytics & AI Maturity Canvas is a versatile tool, applicable in various stages of strategy and implementation:
- Analyzing Current Maturity: Use the canvas to assess existing analytics and AI applications within a specific domain, identifying the current maturity level and capabilities.
- Strategic Roadmap Development: Plan the progression of analytics and AI applications, considering dependencies and sequential builds to ensure sustainable advancement.
- Implementation Sequencing: Structure the order of application development and enhancement, considering prerequisites and pathways to higher analytics maturity levels.
- Post-Ideation Review: After generating analytics and AI use cases, use the canvas to map out each application’s current stage and understand where improvements or expansions make sense.
How Do I Use the Analytics & AI Maturity Canvas?
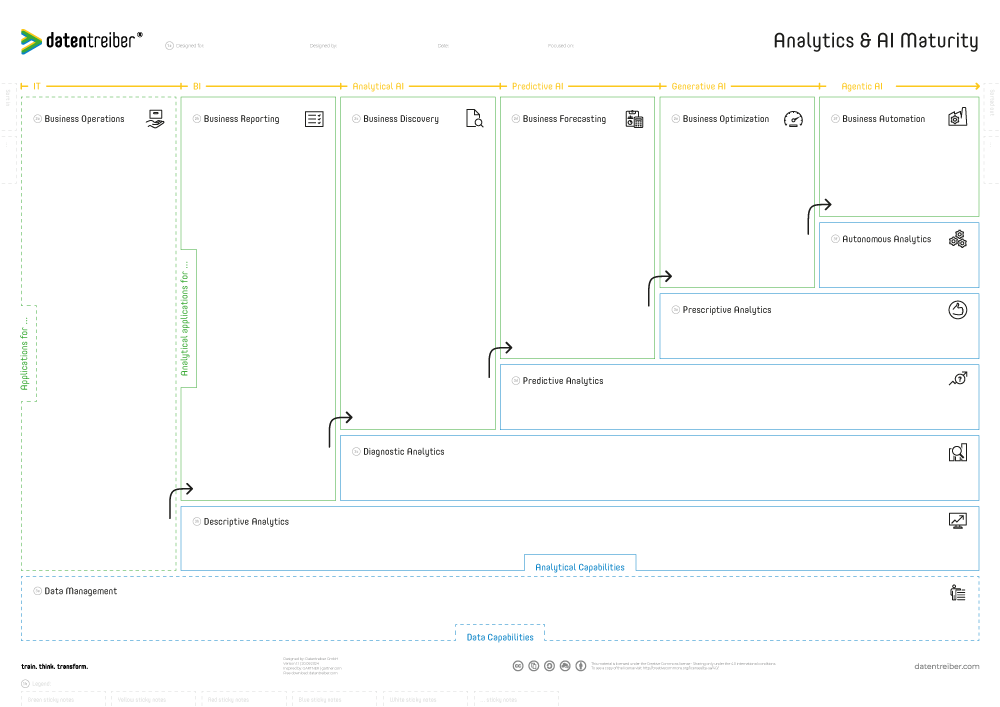
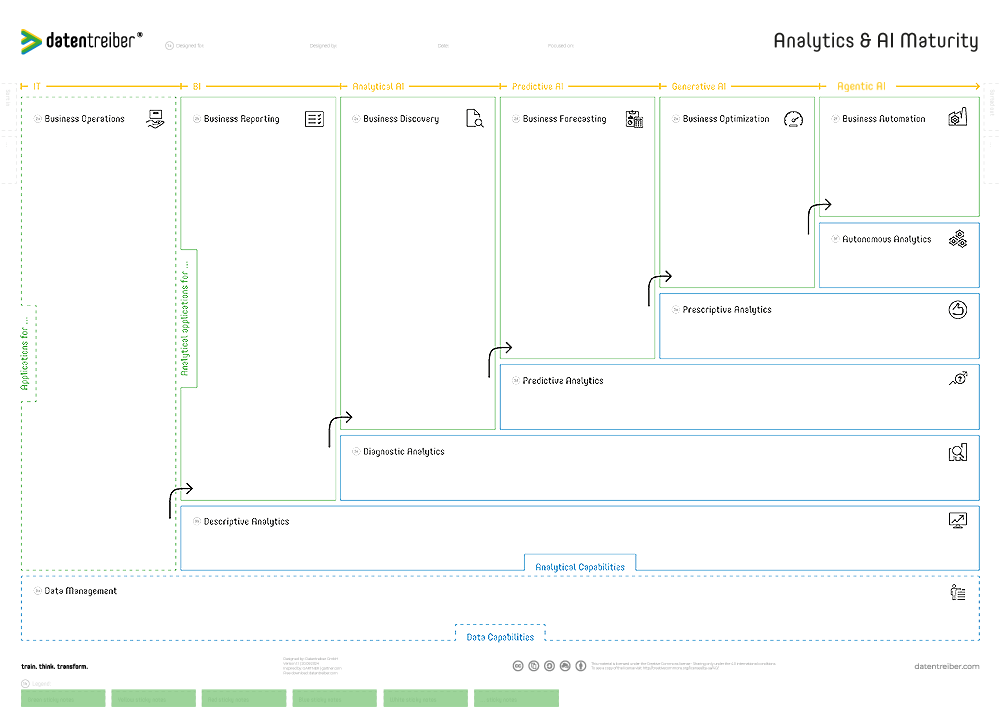
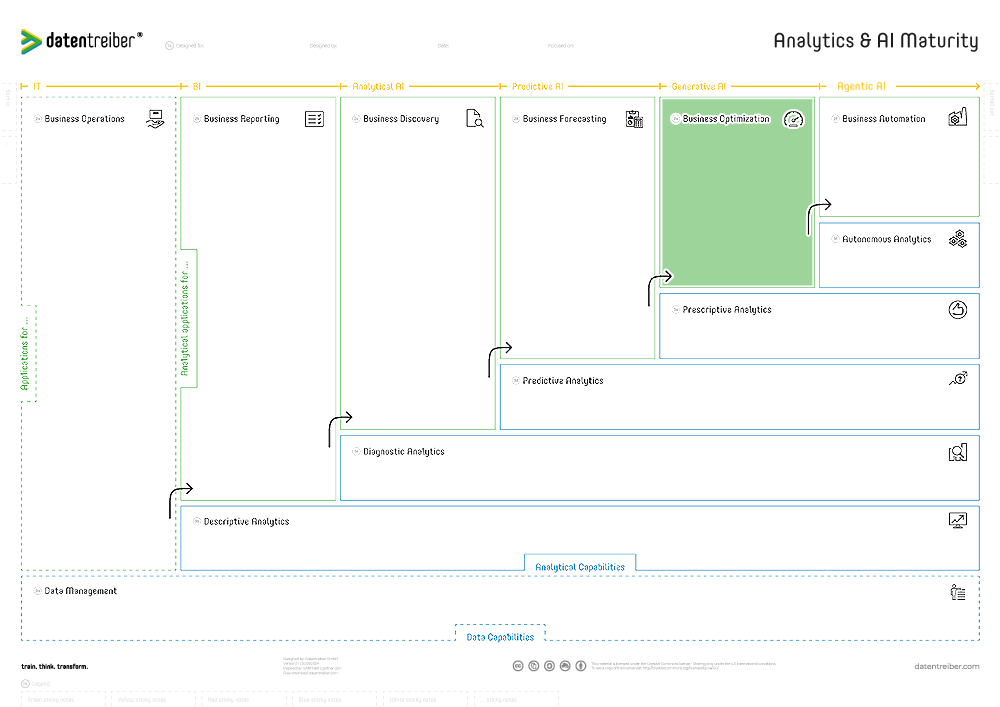
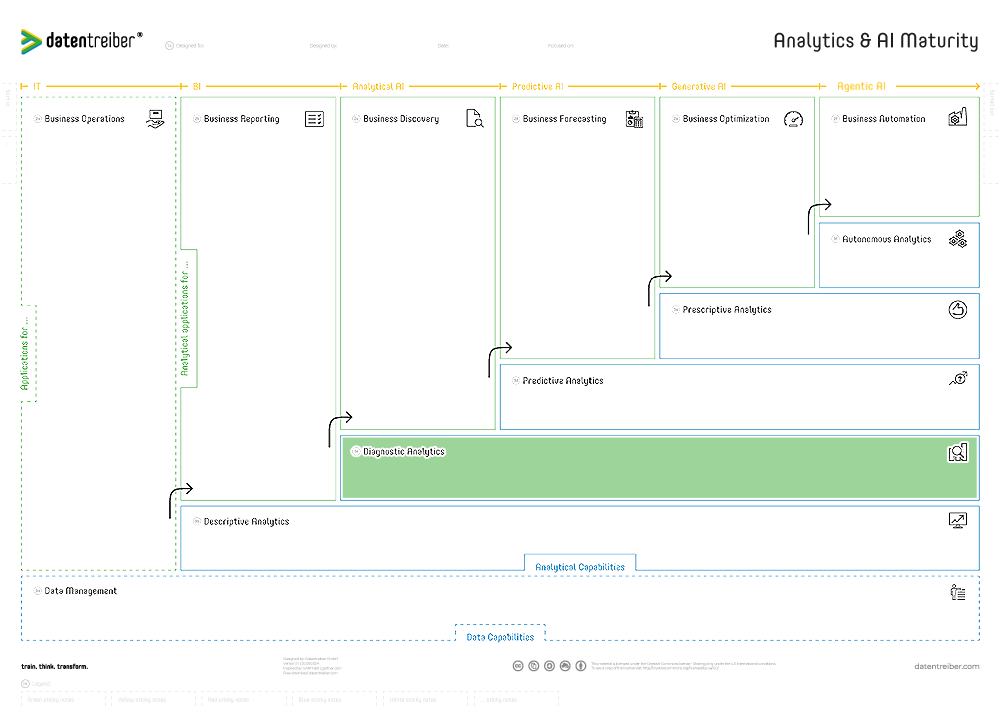
The analytics and AI maturity model describes the evolution of data-driven business applications from basic business intelligence to advanced artificial intelligence.
Based on Gartner’s analytics maturity model, which defines levels of complexity from descriptive to prescriptive analytics, this model extends with a 0th level for data management and a 5th level for autonomous analytics. The canvas distinguishes between:
- Analytical Capabilities: Tools, techniques, skills, etc., intended for use by data and AI experts (blue boxes).
- Analytical Business Applications: Customized internal solutions or external commercial products built by experts using the tools and techniques for business users (green boxes).
- Data Management Capabilities: Tools, techniques, skills, etc., to store, process, and manage data (dotted blue box).
- Non-Analytical but Data-Driven Business Applications: IT applications for business operations (dotted green box).
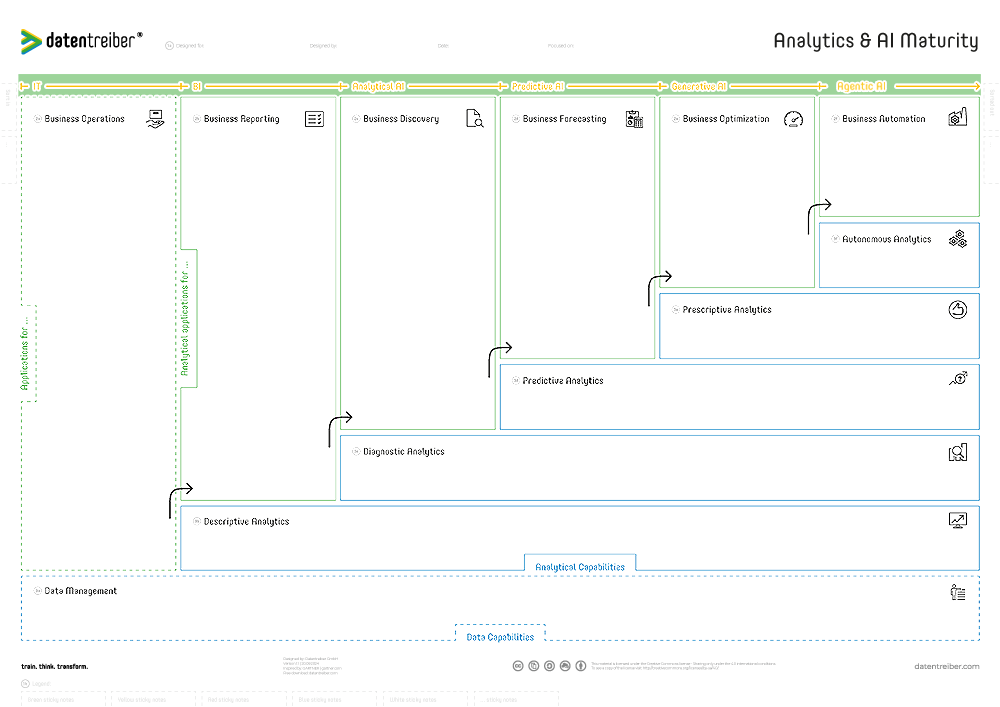
- User Perception: How users perceive and categorize the application (yellow headings).
Specialized tools always require trained experts and defined procedures, so the blue boxes also include human skills (expertise, experience, know-how, etc.) and analytical techniques.
Together, these are referred to as capabilities. For example, evolving from business reporting to business discovery requires tools, techniques, and skills for diagnostic analysis. Diagnostic analytics relies on proper descriptive analytics as a foundation. Thus, to advance from left to right, the analytics technology stack (also called tech stack) and skill set must be built from the bottom up.
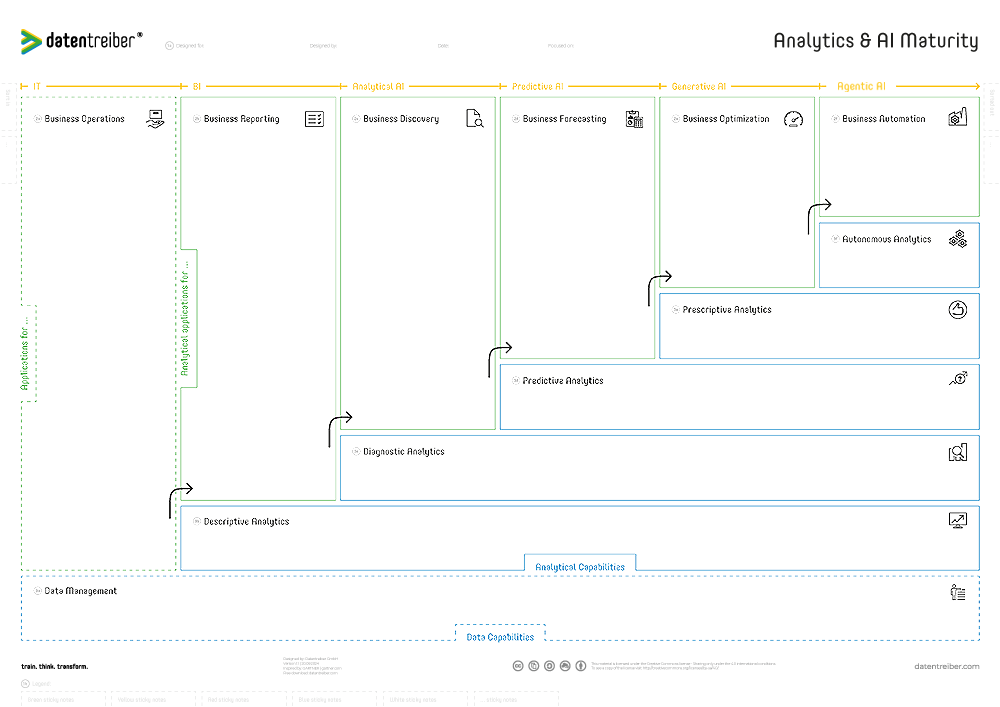
Unlike well-defined analytics terminology, terms like “business intelligence” (“BI”) or “artificial intelligence” (“AI”) are more vague and used in different ways, especially to market products. The classification of an application as “IT,” “BI,” or “AI” (see yellow headings at the top) often depends more on the user’s perspective.

The Canvas Sections
- AI Maturity
- 1a Header
- 1b Footer
- 2a Business Operations
- 2b Business Reporting
- 2c Business Discovery
- 2d Business Forecasting
- 2e Business Optimization
- 2f Business Automation
- 3a Data Management
- 3b Descriptive Analytics
- 3c Diagnostic Analytics
- 3d Predictive Analytics
- 3e Prescriptive Analytics
- 3f Autonomous Analytics
AI Maturity
In everyday language, users and providers of software use terms such as “IT application”, “BI application” or “AI application”. The classification of an application as “information technology”, “business intelligence” or “artificial intelligence” is not unambiguous:
IT refers to all forms of digital data/information processing applications – analytical or not.
BI refers to applications that gain insights from data. Nowadays, the term is mostly used for simple reporting or dashboard applications, whereas applications with advanced analytics (e.g. predictive) are referred to as “business analytics”.
Analytical AI is often used in contrast to “Generative AI” to make it clear that it only analyzes but does not generate anything. However, generative and other forms of AI also use (data) analytical components, meaning that most AI is (partly) analytical.
Predictive AI is often used synonymously with predictive analytics and in distinction to generative AI, although generative AI is also often only predictive: a large language model (LLM), for example, predicts the probable next-best words or sentences based on the input (“prompt”).
Generative AI generates texts, images, audio and much more based on the trained content and the prompt (user input). The trained AI model is referred to as the “Foundation Model”, and in the case of text as the “Large Language Model” (LLM). Models that support different types of content are referred to as multimodal. With appropriate techniques (such as prompt engineering), the output can also be optimized for specific objectives.
Agentic AI comes closest to the original definition or vision of artificial intelligence: intelligent (software) agents make decisions and take actions autonomously, measure and analyze the data and learn from the results how to achieve their objectives. They use generative AI as a “human language interface” to interact with people and other machines.
In addition to these terms, there are many others, for example:
- Conversational AI: To describe chatbots & co.
- Interactive AI: To classify interactive AI systems in general.
- Narrow AI or Weak AI: To categorize very specific AI solutions with limited capabilities.
- General AI or Strong AI: Also known as “Artificial General Intelligence” (AGI), to describe human-level intelligent systems.
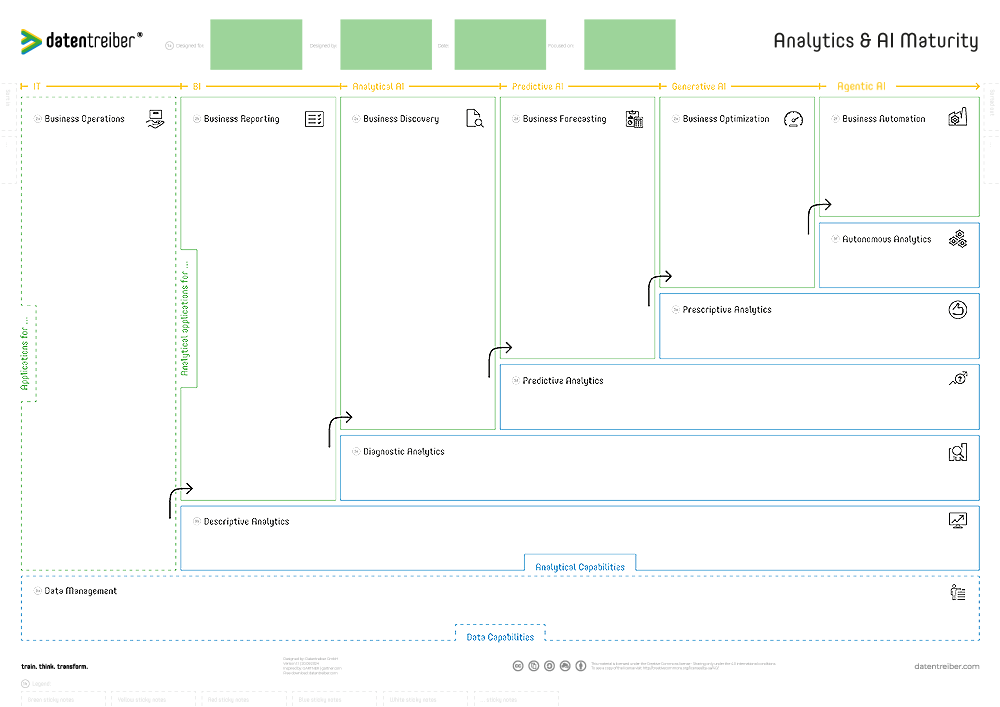
1a Header
The header defines the content of the canvas and should consist of the following information:
- Designed for: Which organization (company, department, team, etc.) does the content of the canvas concern?
- Designed by: Which organization (company, department, team, etc.) created the content?
- Date: When was the content created or last updated?
- Focused on: On which area/topic/case/etc. does the content of this canvas focus?
There should be no copies of the same canvas with identical headers, i.e., the header clearly identifies a version of the canvas (copy) and documents the current status of its content.
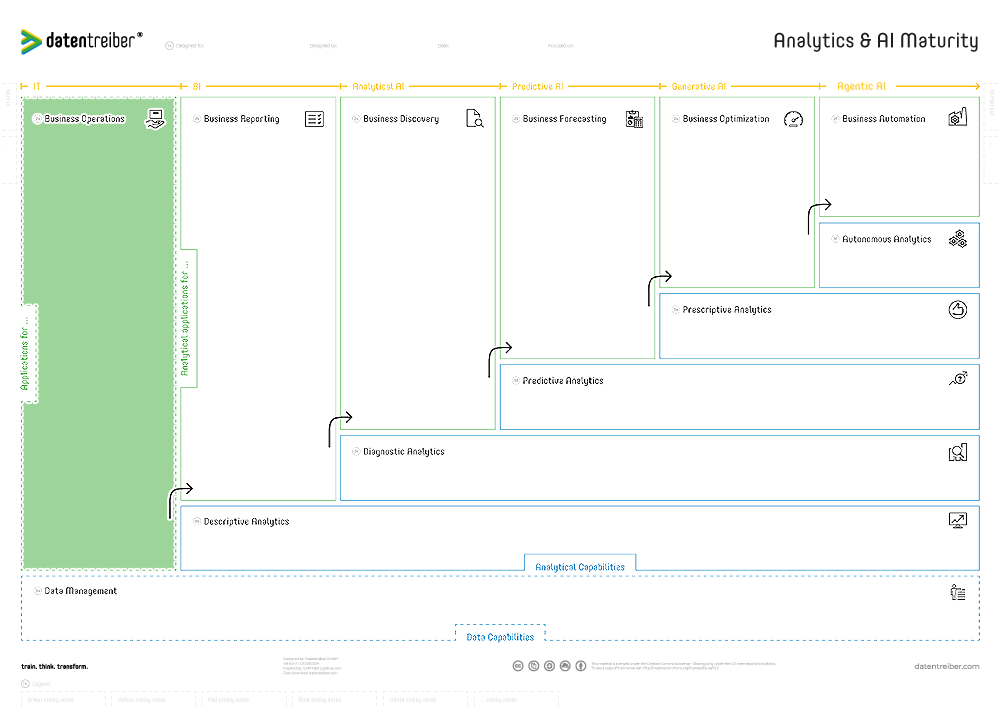
2a Business Operations
What are applications for operating the business?
An information technology (IT) application for business operations is any software or hardware, or a combination of both, used to operate business processes.
This includes controlling and documenting decisions, actions, results, and objectives. It performs basic digital data processing (e.g., create, change, delete, select) to store and deliver information for end users.
Examples of IT applications for business operations include:
- Customer Relationship Management (CRM)
- Enterprise Resource Planning (ERP)
- Content Management System (CMS)
Operational business applications are based on database management systems (DBMS) such as SQL databases for data storage and processing.
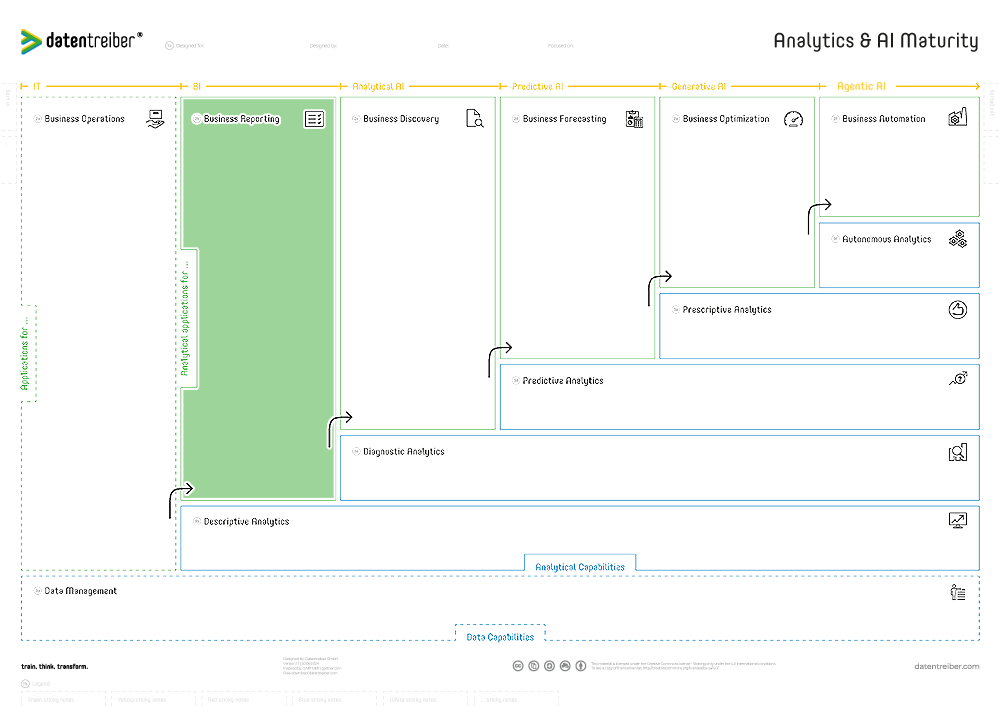
2b Business Reporting
What are analytical applications for reporting business figures?
An analytical business reporting application uses descriptive analytics to automatically create reports or dashboards from business data about performance, processes, operations, objectives, etc.
It uses data visualization techniques (charts, tables, etc.) to inform end users about business metrics and key performance or quality indicators (e.g., KPIs).
Often, business reporting is integrated into business applications. For example, a CRM application provides a sales report. However, custom solutions are often required to analyze and visualize data from multiple systems, such as combining CRM and CMS or web tracking data to analyze the online sales funnel.
The term “business intelligence” is sometimes used to describe basic business reporting.
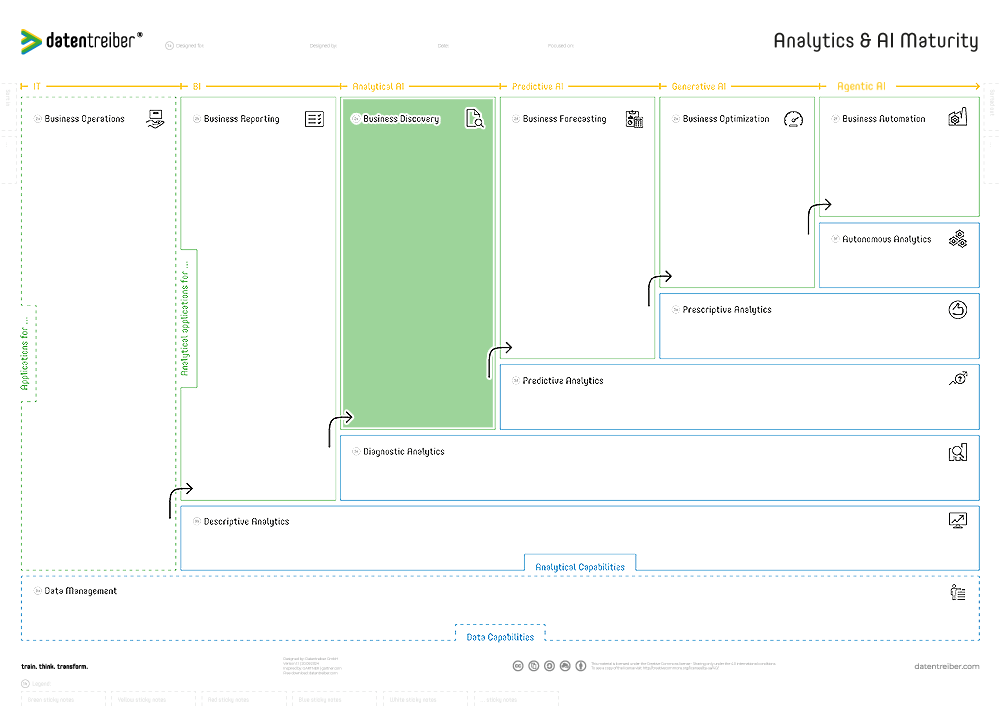
2c Business Discovery
What are analytical applications for discovering business insights?
An analytical business discovery application uses diagnostic analytics to automatically identify correlations, trends, or outliers among business metrics.
It applies statistical methods to validate these insights, such as calculating the correlation coefficient or significance level. Business users leverage these findings to optimize their products, services, or processes.
Diagnostic analyses are often conducted as ad hoc analyses by analytics experts using specialized tools, as there is typically no ready-made application for end users.
In some cases, business users themselves attempt diagnostic analyses using descriptive analytic tools, such as self-service BI. Without the right tools and necessary statistical expertise, they often derive incorrect insights, leading to poor decisions.
Business discovery applications close this diagnostic gap but still require users to have basic statistical knowledge. Business discovery applications often serve as a precursor to business forecasting applications and can also make the forecasts of predictive analytics applications explainable.
2d Business Forecasting
What are analytical applications for forecasting business metrics?
An analytical business forecasting application uses predictive analytics to forecast business metrics and events. It applies statistical, probabilistic, or other mathematical methods to create a predictive model from training data.
This model is then used to forecast future events or outcomes and assess their probabilities.
Predictive applications can also be used for “nowcasting”: if the event has already happened or the outcome has already been determined but could not be measured, the business forecasting application detects or estimates the current or even past event or outcome.
Business forecasting applications often require business users to have a high level of data and AI literacy, as the predictions are subject to a high degree of uncertainty and require interpretation of the probabilities.
Predictive models can also be used for simulations to explore different actions and situations in multiple scenarios. They are therefore a precursor for business optimization applications.
2e Business Optimization
What are analytical applications for optimizing business decisions and processes?
An analytical business optimization application uses prescriptive analytics to propose optimal actions to fulfill a given objective.
Optimal refers to the effectiveness and efficiency of an action. An action is effective if its result contributes to the achievement of the objective. It’s efficient if the resources used are in a viable relationship to the result.
Prescriptive analytics is used to find the optimum of efficiency and/or effectiveness for a set of possible actions and potential situations. Mathematical optimization or simulation algorithms are often used for this purpose.
Particularly in the case of high-risk applications, business users must be appropriately trained to critically examine the recommendations of the applications.
If this final human instance is missing, it becomes an autonomous application for business automation, which requires additional analytics, e.g., to assess risks.
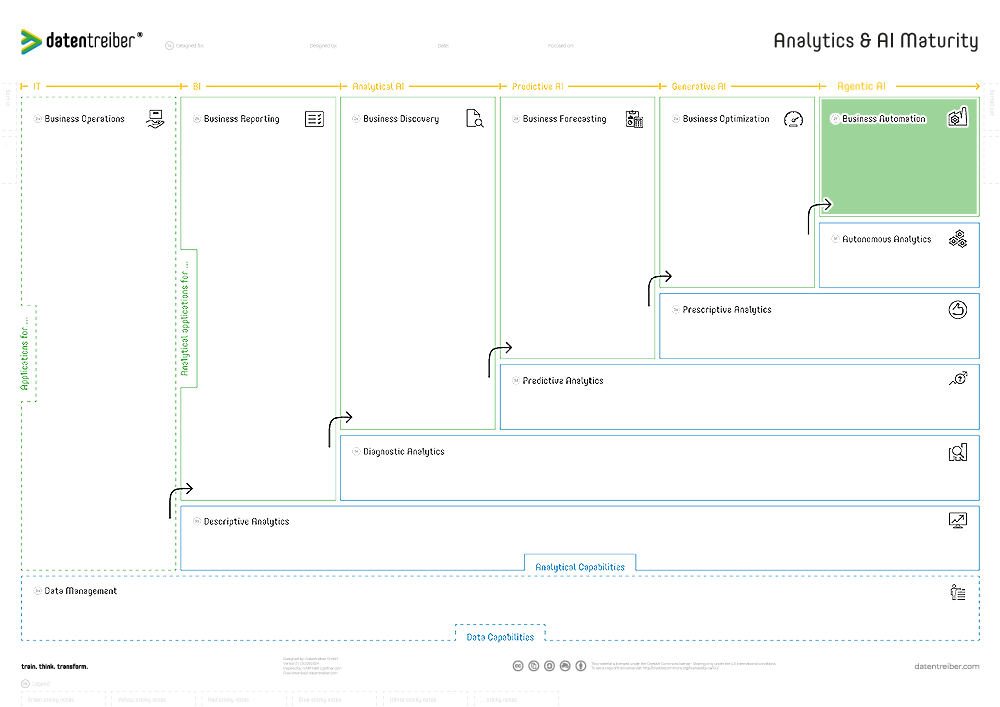
2f Business Automation
What are analytical applications for automating business processes?
An analytical business automation application uses autonomous analytics to automate business processes, maximizing the effectiveness and efficiency of fulfilling a given objective.
It employs techniques such as reinforcement learning or other systematic experimental methods to determine the best actions or sequence of actions to achieve the objective.
In specific situations, it autonomously makes optimal decisions under the given circumstances and takes immediate action without human interaction.
However, autonomous applications often require human supervision, especially for legal reasons, involving active monitoring and control. Therefore, autonomous analytics frequently implements fallback mechanisms:
- If the calculated risk is too high (i.e., information is missing), the autonomous analytics delegates the decision and/or action to a human.
Analytical business automation applications behave as autonomous and intelligent agents and are also called artificial intelligences (AI). However, the term “artificial intelligence” is used in an inflationary way, and there are varying views on what constitutes an AI and when an IT application qualifies as an AI application.
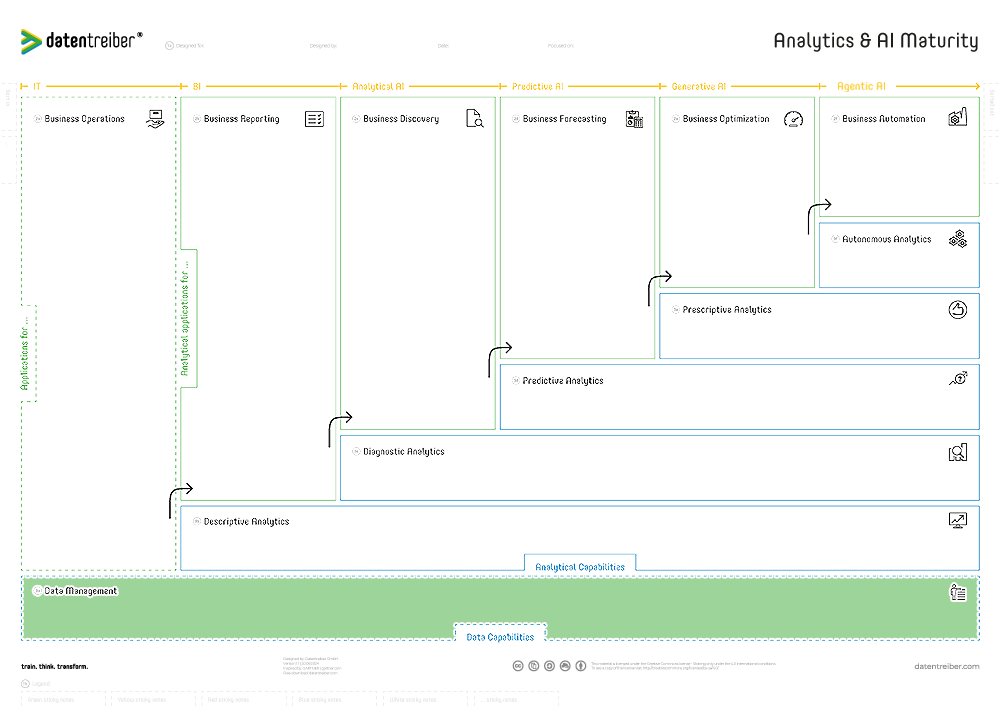
3a Data Management
What are capabilities for managing the data?
Data management involves treating company data as a corporate asset. Tools such as database systems and metadata catalogs help to increase data quality and accessibility and ensure data security and privacy. Data management is essential for data monetization.
Monetizing data means creating monetary value from data, not necessarily through direct monetization, such as selling data, but also indirectly through improving business decisions, processes, and models.
However, data cannot be used directly for decision-making. Decision-makers need information, i.e., answers to specific questions. Analytics and AI are needed to extract this information from the data. Thus, data management is the foundation for successful data analytics and AI.
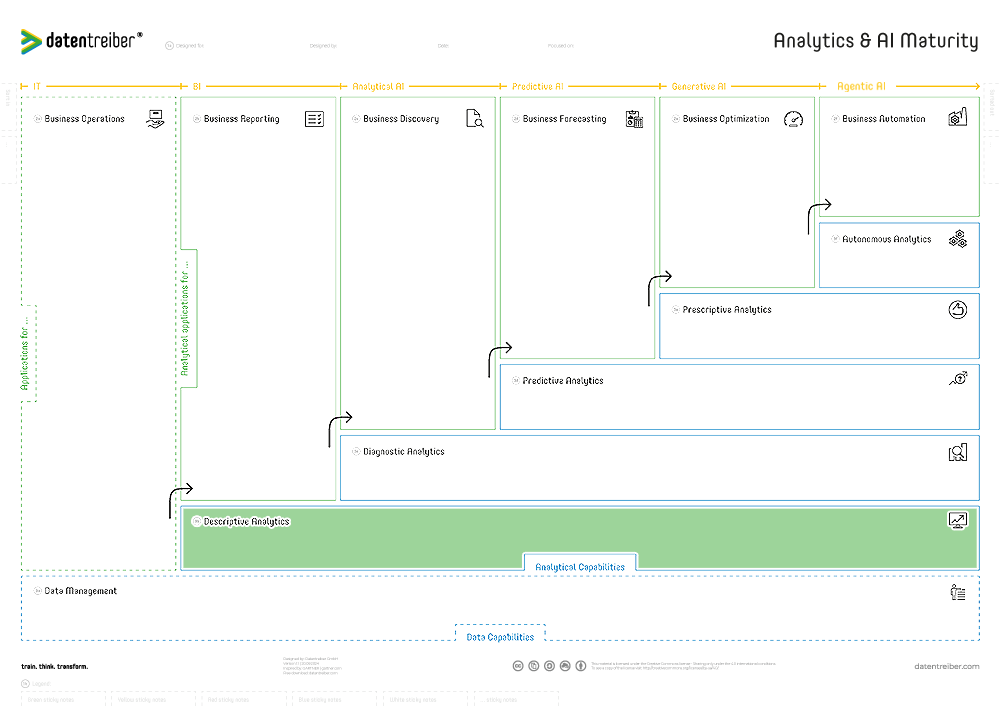
3b Descriptive Analytics
What are capabilities for descriptive analysis?
Descriptive analysis describes what happened, providing hindsight.
Descriptive analytics calculates metrics (e.g., totals, averages, deviations, maxima, frequencies) and key performance indicators (KPI) or quality indicators from the data.
Therefore, descriptive analysis relies on proper data management, as poor data quality leads to incorrect metrics and ultimately poor decisions.
The results of descriptive analysis still require a high degree of interpretation by the decision-maker. Often, a descriptive analysis is followed by a diagnostic analysis to investigate the reasons for not reaching an objective.
3c Diagnostic Analytics
What are capabilities for diagnostic analysis?
A diagnostic analysis explains why something happened, providing insight.
Diagnostic analytics identifies drivers, correlations, anomalies, trends, and other patterns. It uses statistical distributions (e.g., normal distribution), experiments (e.g., A/B tests), and tests (e.g., t-tests) to verify insights.
It calculates metrics such as correlation coefficients, significance levels, or p-values, leveraging metrics from descriptive analyses. Diagnostic analytics typically uses non-aggregated data and works with anonymized data.
A decision-maker uses the results of a diagnostic analysis to plan and adapt future measures. To determine which metrics warrant a diagnostic analysis, descriptive analyses often precede the diagnostic analysis.
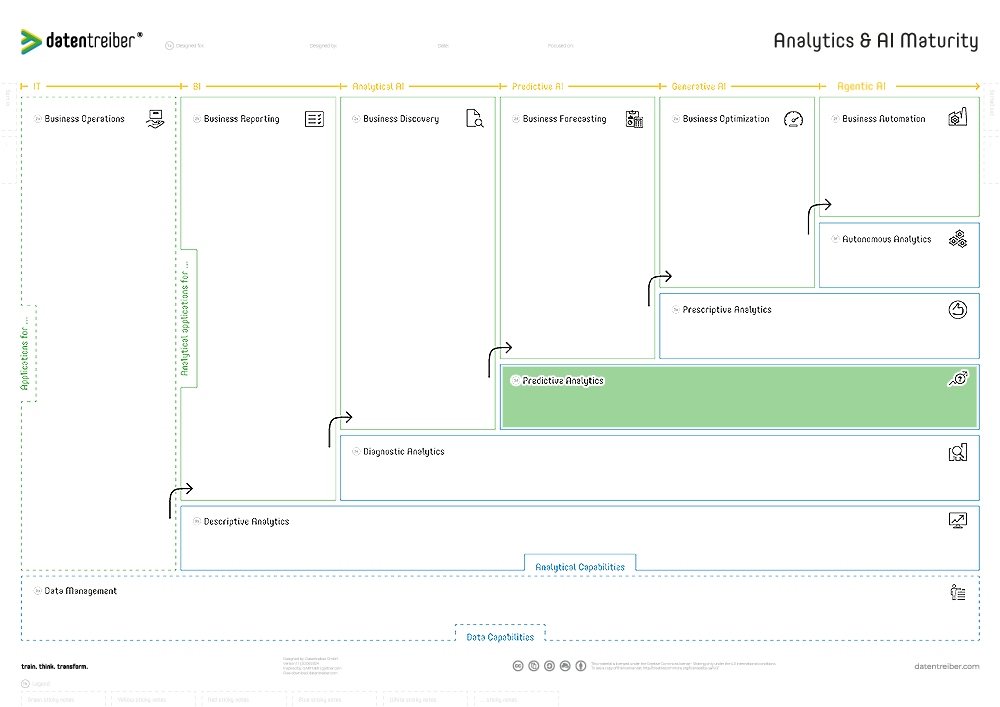
3d Predictive Analytics
What are capabilities for predictive analysis?
Predictive analysis predicts what could happen, providing foresight.
Predictive analytics uses techniques such as regression analysis, machine learning, and time series analysis to create predictive models that estimate future values or the probability of future events.
Sometimes, predictive analytics is used for detection or estimation rather than prediction when the event has already occurred or the value is already set but cannot be directly detected or measured.
There are many tools and techniques for predictive analytics that can be categorized in multiple ways:
- Information Predicted: Classification for categorical values, regression for numerical values, clustering for similarity, etc.
- Data Availability: Supervised learning for labeled data vs. unsupervised learning for unlabeled data.
- Learning Algorithms: Machine learning, deep learning, ensemble learning, etc.
- Data Types: Data mining, text mining, graph mining, video mining, etc.
- Priority: Explainability (white box techniques) vs. accuracy (black box techniques).
The right choice of technique and tool depends on the business objective and data quality. Therefore, predictive modeling is often preceded by exploratory data analysis using diagnostic analytics. Descriptive analytics is needed to measure and monitor the model performance (e.g., accuracy) and business performance (i.e., business impact) of the predictive model.
Most predictive algorithms require non-aggregated data, and depending on the use case, they often require non-anonymized data. Based on predictions (or detections/estimations), a decision maker can make or adapt necessary decisions in advance or simulate different decisions for various scenarios.
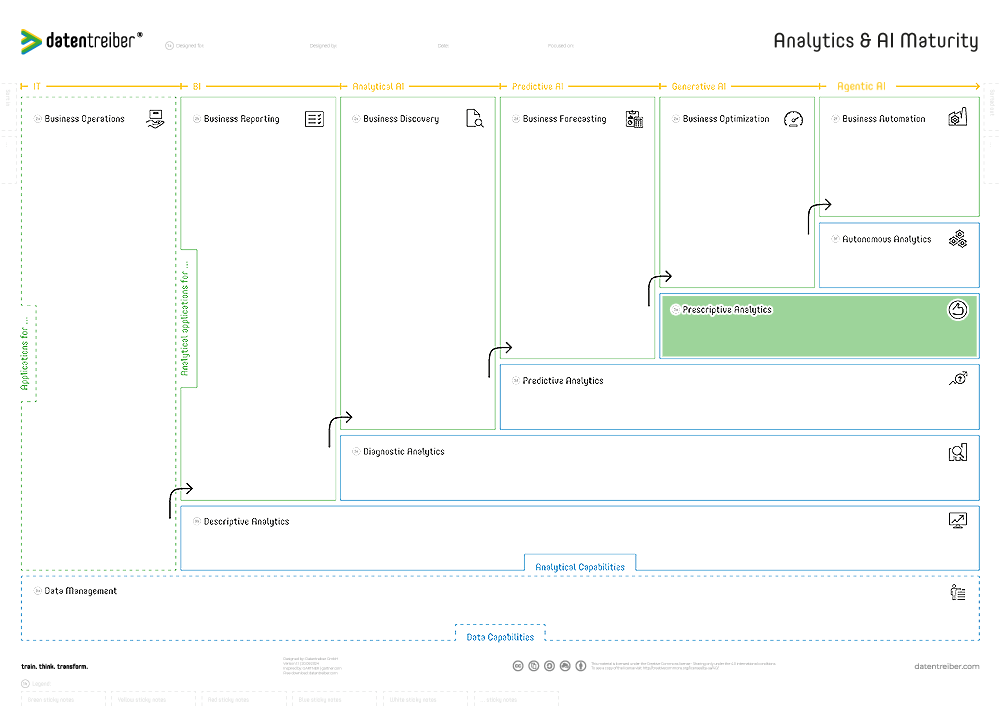
3e Prescriptive Analytics
What are capabilities for prescriptive analysis?
A prescriptive analysis “prescribes” what should happen to fulfill a given objective, proposing specific actions instead of just providing information.
Prescriptive analytics uses optimization and simulation algorithms to evaluate future scenarios and options for action in terms of costs and benefits. It relies on predictive analytics to forecast future events and outcomes of potential actions.
Additionally, it requires descriptive analytics to measure the impact (business performance) of the prescribed action and diagnostic analytics to explain the reasoning behind the prescribed action to decision-makers.
On the data level, non-aggregated and often non-anonymized data is needed. Prescriptive analyses still require a decision-maker to choose an option and take the subsequent action.
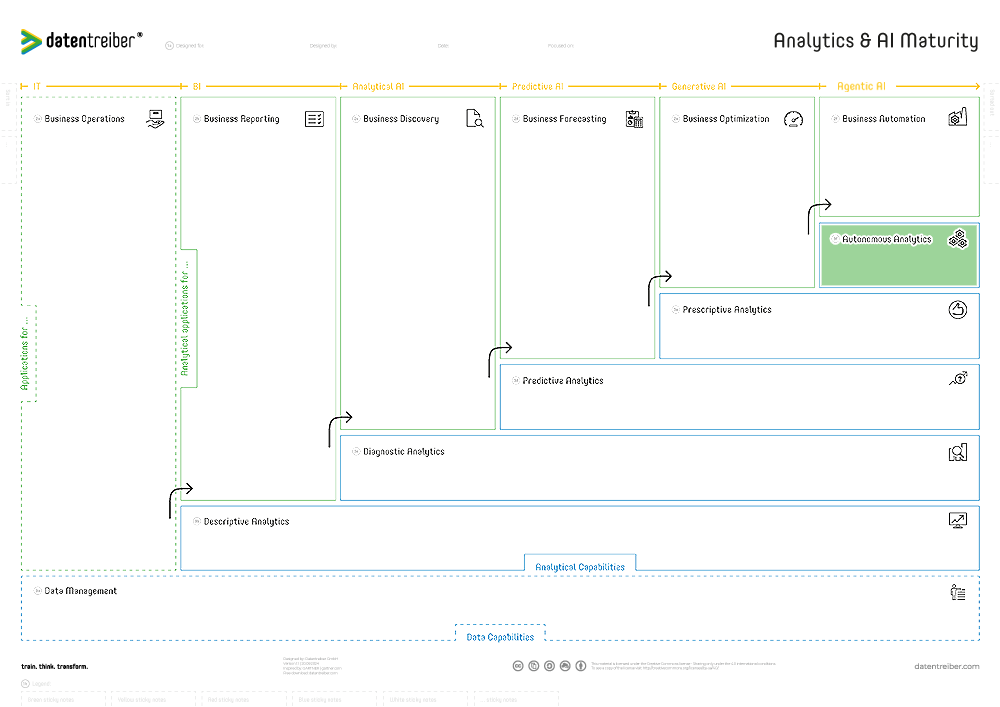
3f Autonomous Analytics
What are capabilities for autonomous analysis?
An autonomous analysis makes a decision on what should happen to fulfill a given objective, takes the required actions without any human intervention, checks whether the results meet the objective, and learns from those experiences. It acts as an intelligent agent.
Autonomous systems are often based on predictive and prescriptive analytics and use techniques such as reinforcement learning for continuous learning (data) and optimization (analytics).
Responsible autonomous systems try to estimate the uncertainty of their experience (i.e., data) and depending on the risks, apply different tactics, e.g.:
- Exploration-Exploitation Cycle: To gather new evidence (data), the system performs experiments, i.e., explores possible actions (the system learns). Next, it exploits this data and decides on the best action (the system earns).
- Human-in-the-Loop (HITL): As a fallback mechanism, the system asks a human expert for manual input or to validate or even make the decision.

Where Can I Find More Information?
- Find detailed tutorials and examples on how to use the canvas in the context of designing a fully integrated data & AI strategy in our Data & AI Design Bench.
- Data-Driven Marketing – The first steps towards a Data-Driven Marketing (SlideShare)