Uncovering Critical Causes and Success Factors
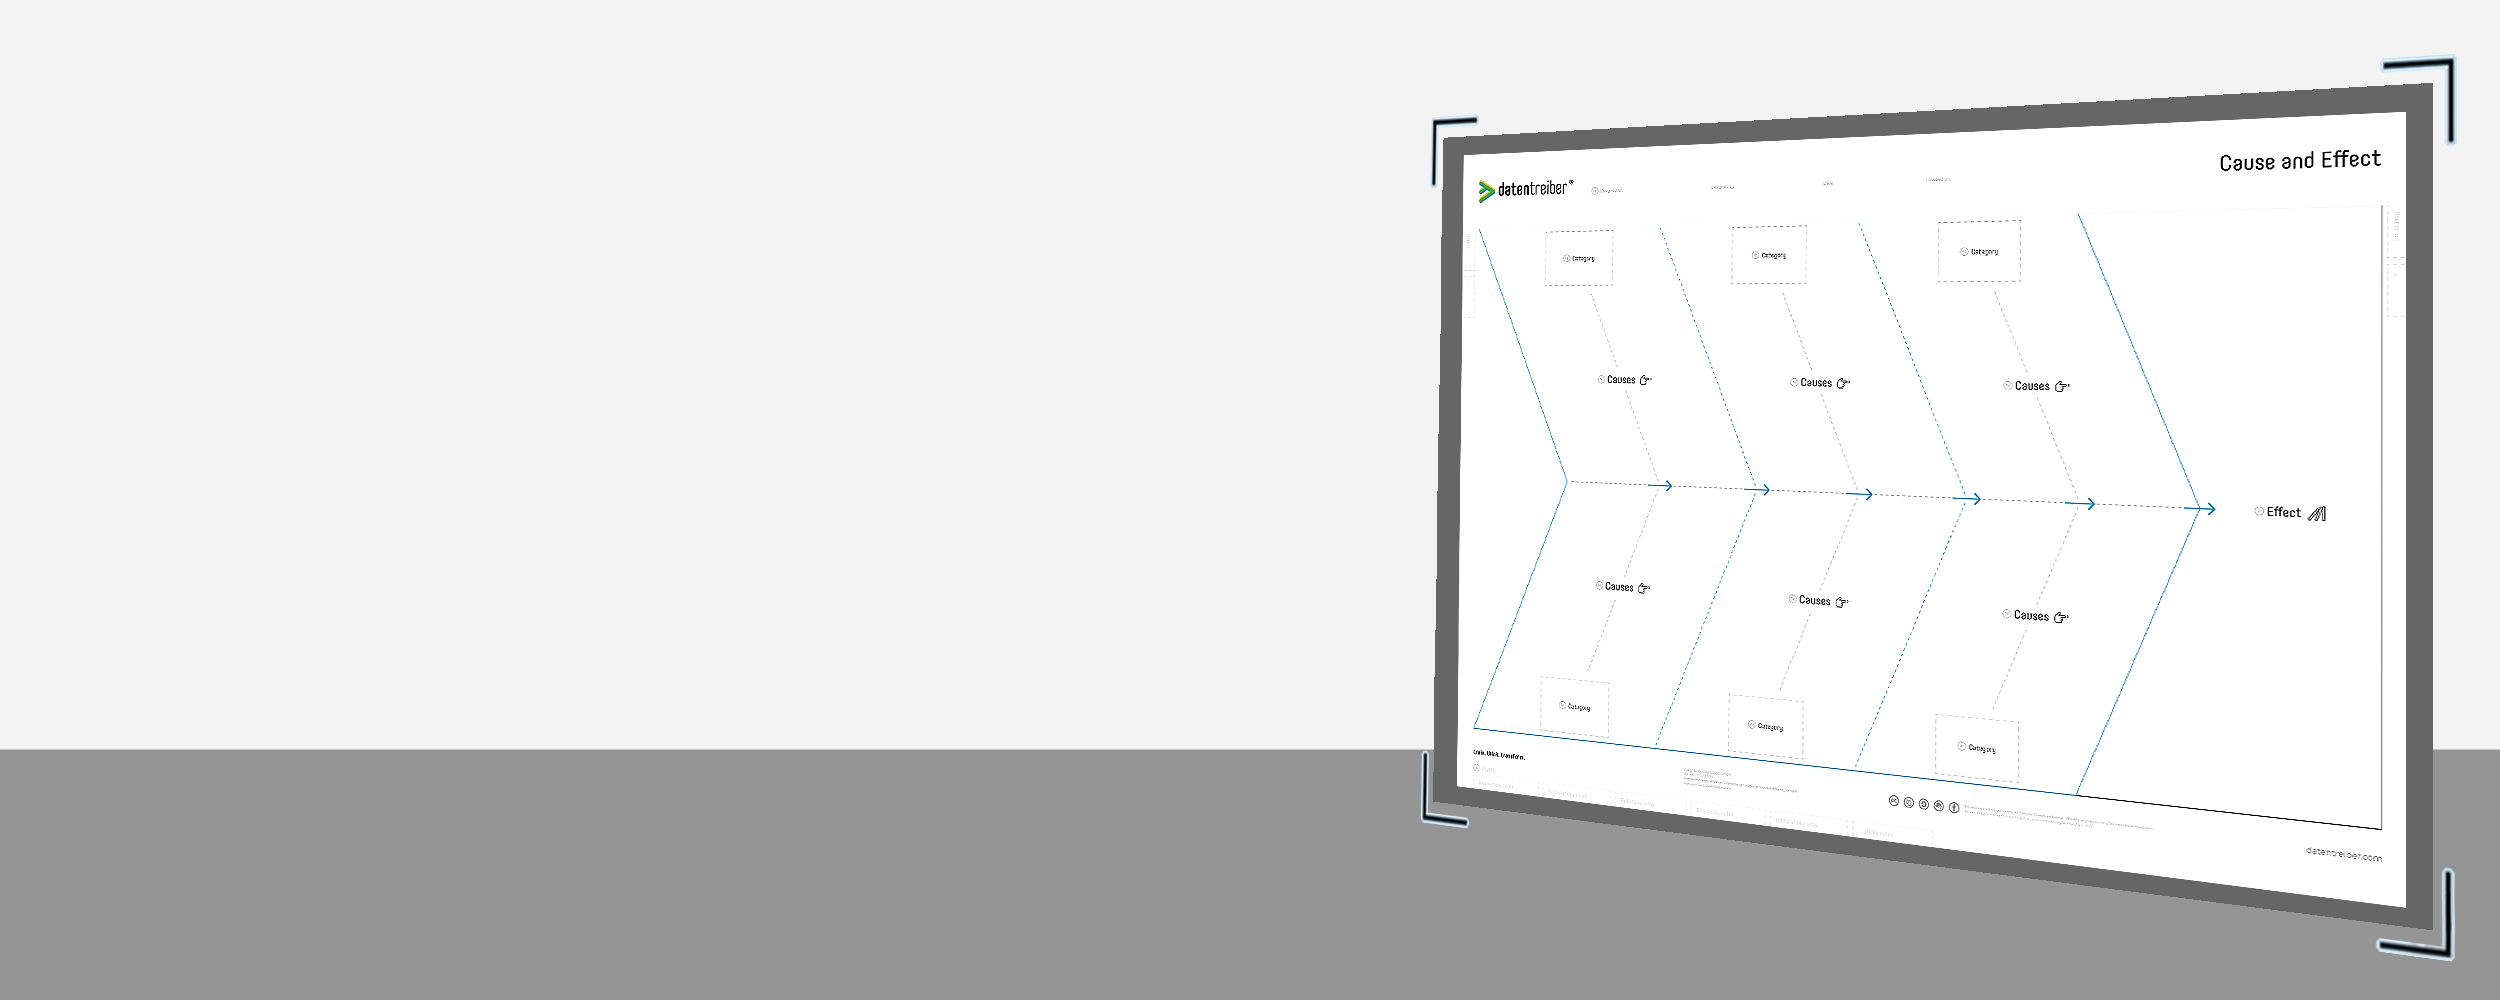
Cause and Effect
Identify the actual causes of problems and the critical factors to achieve your goals with the Cause and Effect Canvas. The Cause and Effect Canvas also allows you to easily and quickly categorize the causes of errors or success drivers.
What is the Cause and Effect Canvas?
The Cause and Effect Canvas is a structured visual tool for identifying the causes behind problems or the critical drivers needed to achieve desired outcomes. Known also as the Ishikawa Diagram or Fishbone Diagram, it organizes causes or factors into categories, visualizes their dependencies, and helps teams focus on the elements that matter most.
By uncovering root causes and success drivers, this canvas supports problem-solving, performance optimization, and goal achievement. Within the Data & AI Business Design methodology, it can also be used to map driver trees, showing the underlying factors that influence performance metrics, data quality, and model outcomes.
The canvas’s flexible structure makes it a powerful resource for workshops, retrospectives, and strategy sessions.
The Cause and Effect Canvas is available for free under a Creative Commons license: You may use and modify the canvas as long as you cite Datentreiber in particular as the source.
When to Use the Cause and Effect Canvas
The canvas is ideal for a range of use cases:
- Problem Diagnosis: Explore the root causes of issues uncovered during retrospectives or operations.
- Goal Achievement: Identify key success drivers for KPIs, OKRs, or business objectives.
- Driver Tree Mapping: Deconstruct high-level objectives into measurable drivers that influence performance or business results.
- Data Product Design: Analyze factors affecting data and AI product success, such as data availability, model accuracy, or user adoption.
- Strategic Decision-Making: Address challenges in process optimization, resource allocation, or cross-departmental collaboration.
By framing causes or drivers visually, the canvas allows teams to collaborate effectively, uncover actionable insights, and prioritize efforts.
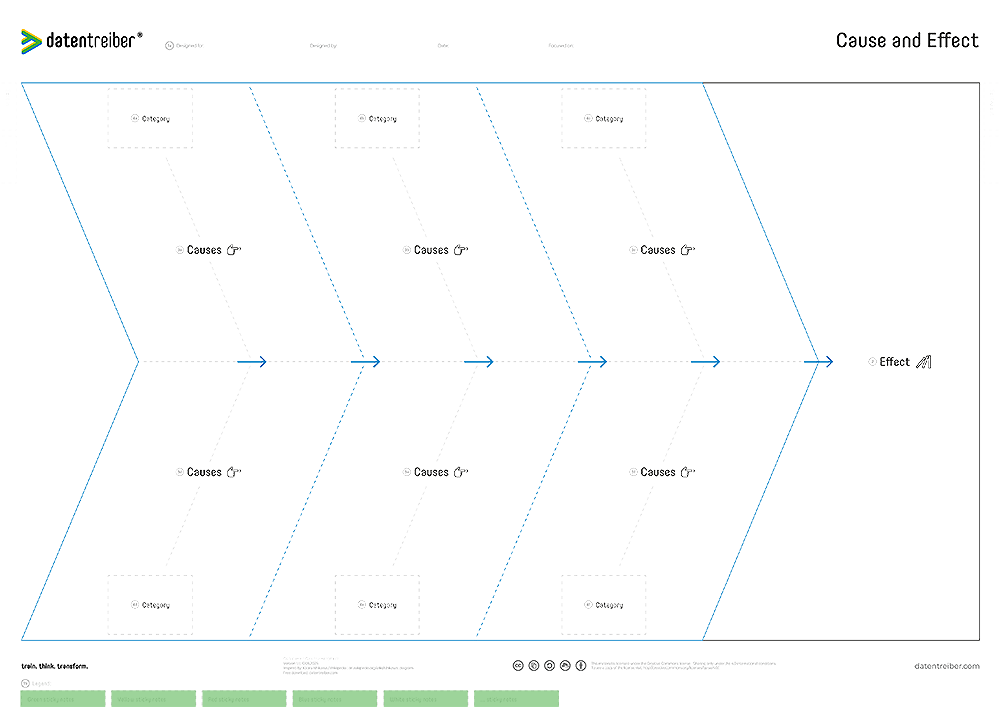
How Do I Use the Cause and Effect Canvas?
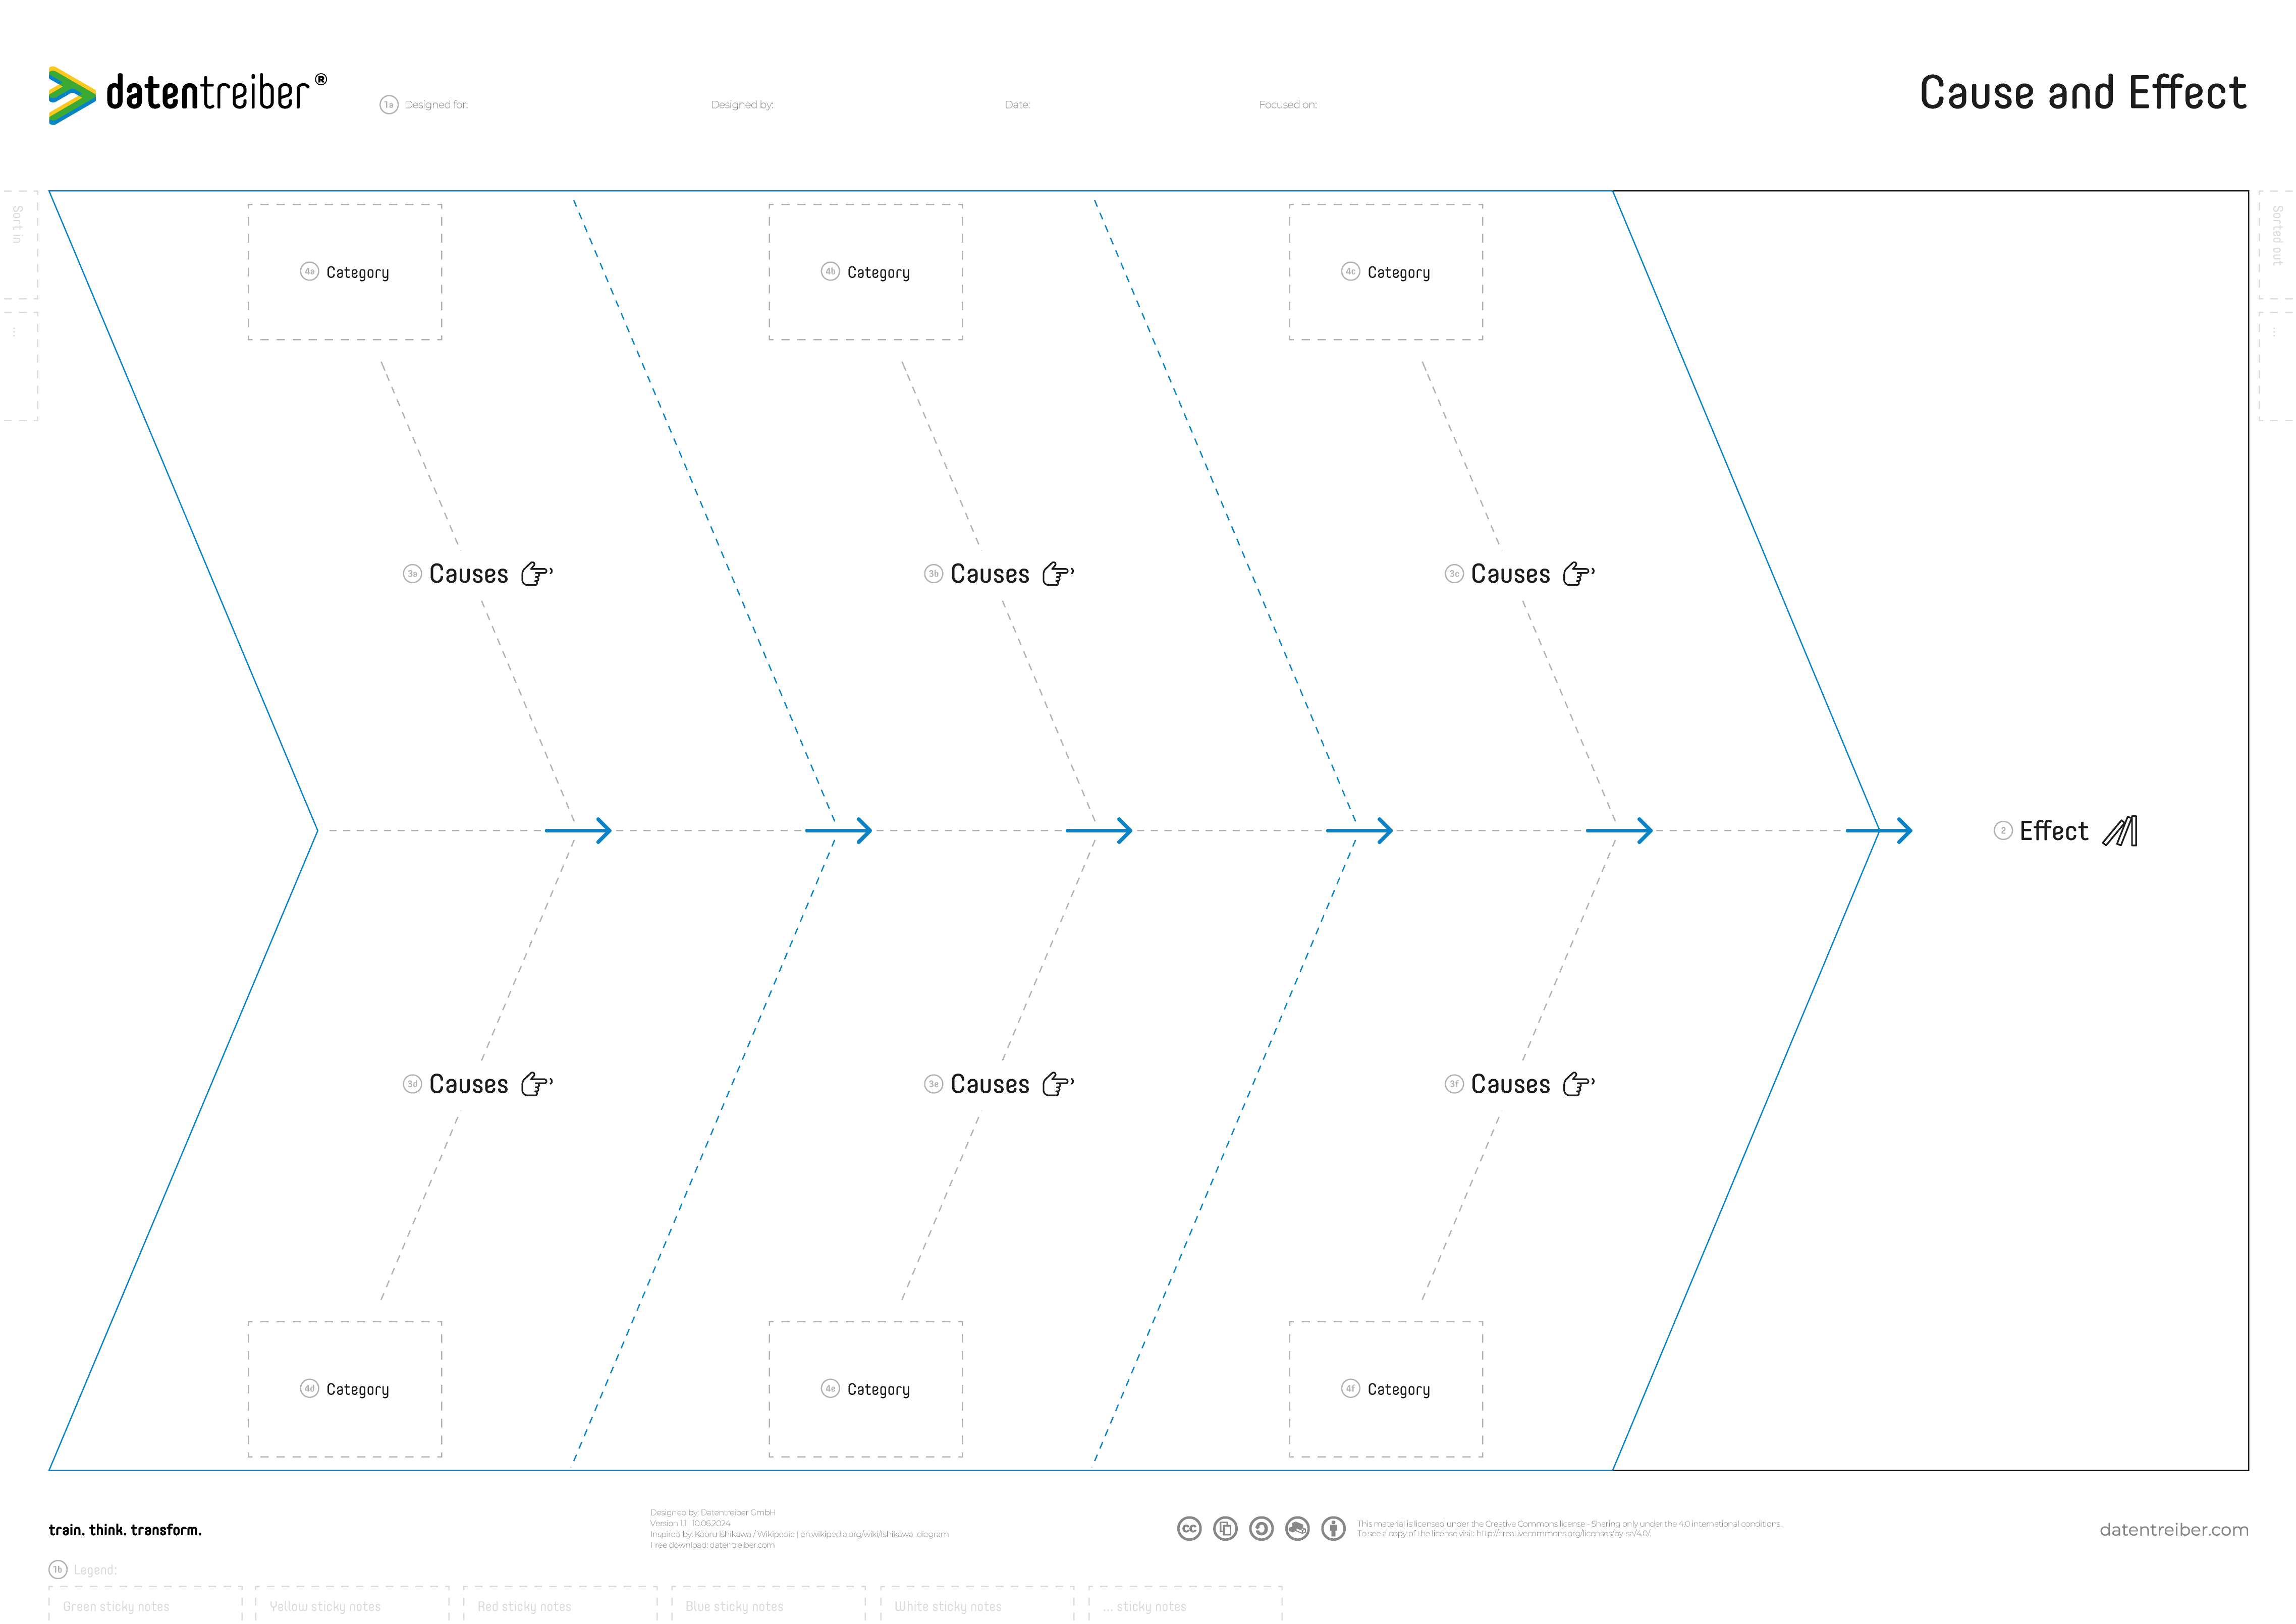
The Cause and Effect Canvas (also known as the Fishbone or Ishikawa Diagram) is used to systematically analyze relationships between an outcome and its underlying influencing factors.
It helps to structure complex situations by linking a clearly defined Effect with a set of Causes and organizing them into meaningful Categories. This makes it possible to understand not only individual factors, but also how they interact and contribute to the overall outcome.
The canvas can be used in two main ways:
• To analyze problems by identifying root causes of an undesired outcome
• To design driver structures by identifying the key levers for achieving a desired goal
In both cases, the approach is the same: start from a clearly defined Effect, expand and connect relevant Causes, and structure them into Categories to make the system understandable and actionable.
The result is a transparent, structured view of cause-effect relationships that supports prioritization, decision-making, and targeted action.
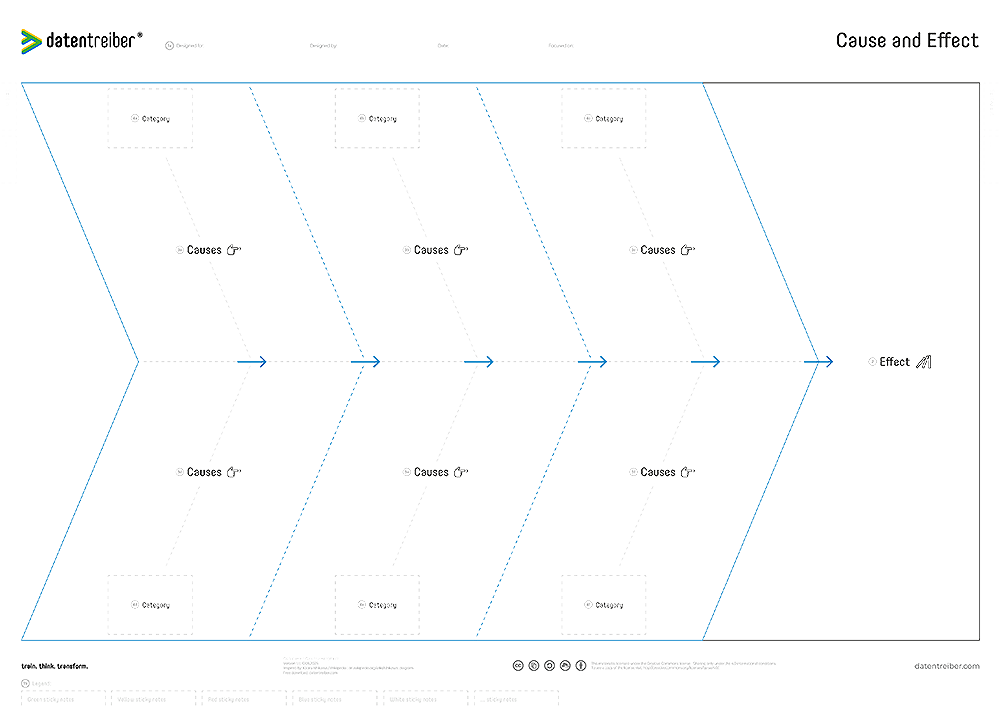
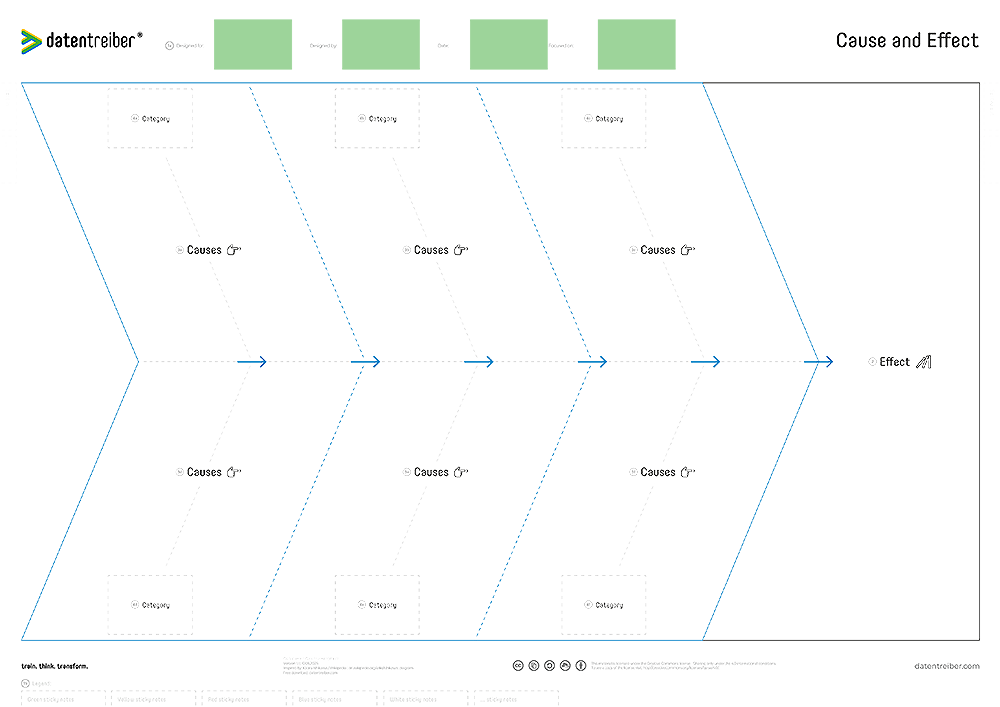
1a Header
The header defines the content of the canvas and should consist of the following information:
- Designed for: Which organization (company, department, team, etc.) does the content of the canvas concern?
- Designed by: Which organization (company, department, team, etc.) created the content?
- Date: When was the content created or last updated?
- Focused on: On which area/topic/case/etc. does the content of this canvas focus?
There should be no copies of the same canvas with identical headers, i.e., the header clearly identifies a version of the canvas (copy) and documents the current status of its content.
1b Footer
The footer explains the coloring of the sticky notes (and other formatting) on the canvas. For each sticky note color, there should be an identically colored or formatted sticky note on the legend with a title explaining this specific sticky note category.
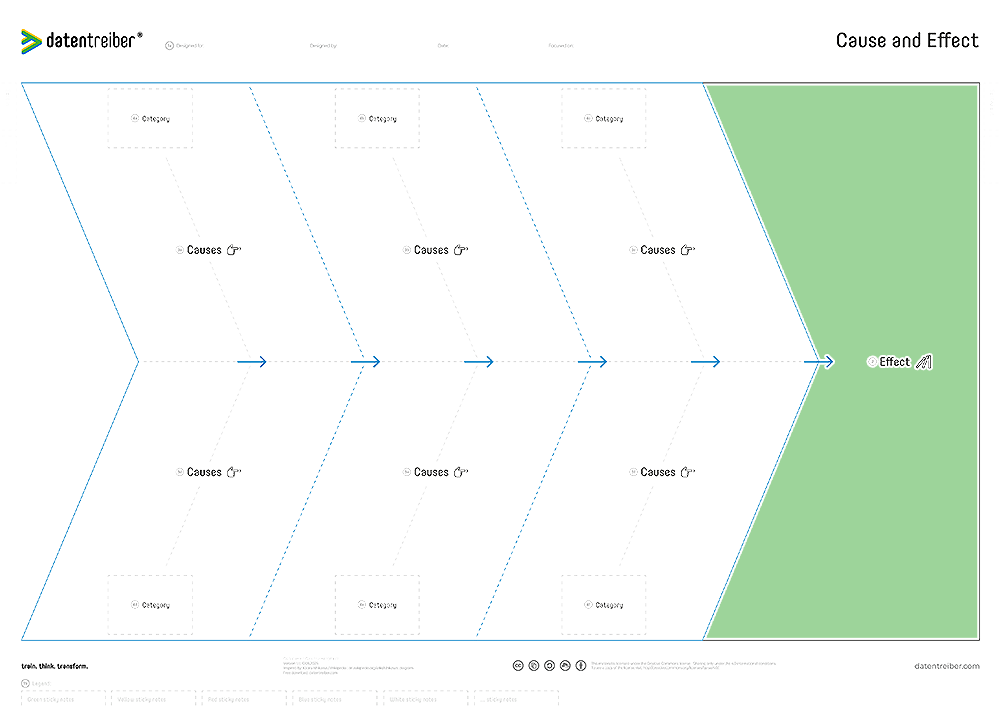
2 Effect
The Effect defines the outcome that the canvas focuses on and is placed on the right side of the canvas.
It can represent either an undesired outcome (problem) or a desired outcome (goal), depending on the use case:
- In a problem context: What went wrong? What error or issue do we observe?
- In a goal-oriented context: What do we want to achieve? What result should be driven?
Start by collecting multiple possible effects, then discuss and prioritize them. One central effect should be selected and clearly highlighted, as the entire analysis will be built around this focal point.
There should only be one primary Effect per canvas to ensure clarity and focus.
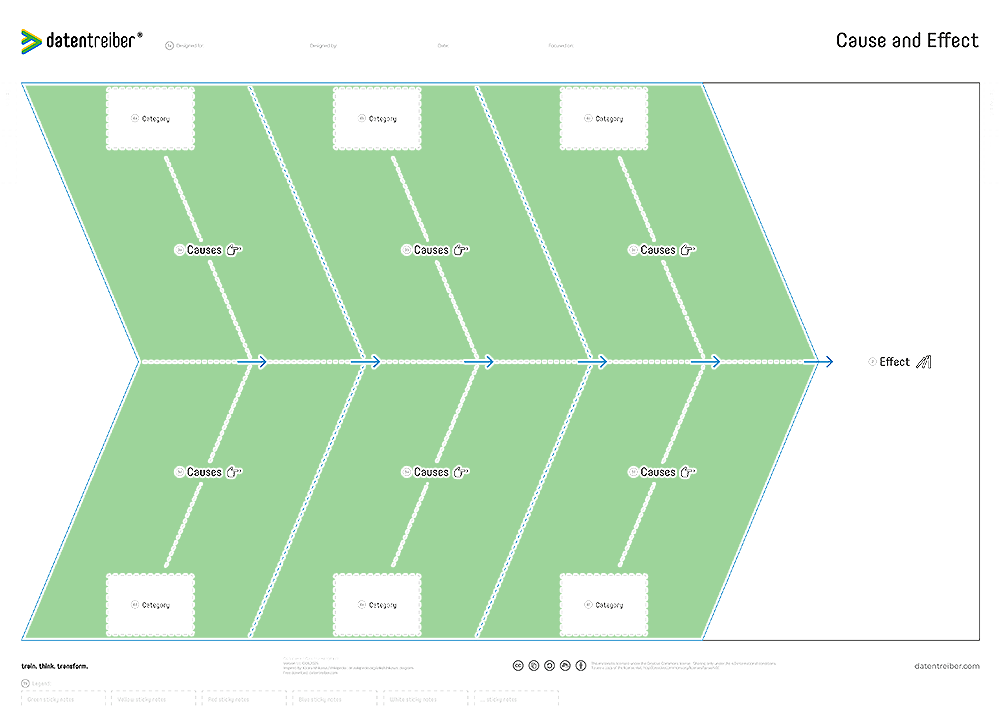
3 Causes
The Causes represent all factors that influence the Effect and are structured on the left side of the canvas along the “fishbone” branches.
These can be:
- Root causes of a problem (in a problem analysis context)
- Success drivers or levers (in a goal or driver-tree context)
Start by collecting potential causes and iteratively deepen the analysis (e.g. using the 5-Why method). Causes can be connected via arrows to visualize causal relationships, dependencies, and hierarchies (e.g. primary vs. secondary causes).
The structure should make visible how different factors contribute to the Effect and how they influence each other.
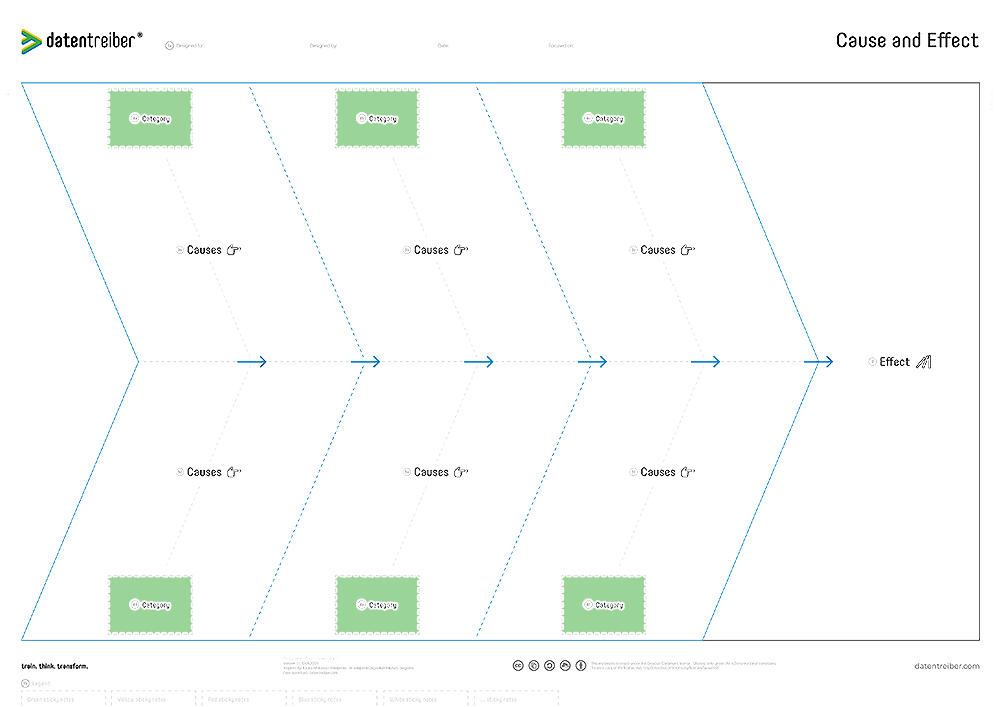
4 Category
The Category fields structure the Causes into meaningful groups and are placed at the top and bottom of the canvas.
They are used to cluster similar causes under shared themes, making the analysis easier to understand and act upon.
Typical categories can include, for example:
- Data
- Model
- Technology / Infrastructure
- Process
- User / Behavior
- Organization / Management
Alternatively, classic groupings such as the Ishikawa 4M (Man, Machine, Material, Method) can be used.
Each category should group related causes and can optionally be assigned to a responsible person or team to support implementation and follow-up.

Where Can I Find More Information?
- Find detailed tutorials and examples on how to use the canvas in the context of designing a fully integrated data & AI strategy in our Data & AI Design Bench.
- Cause-Effect Diagram (Wikipedia)
- Data Thinker Group (LinkedIn)